Design Manual for Roads and Bridges


Sustainability & Environment
Appraisal
LA 105 Air quality (vertical barriers)
(formerly HA 207/07, IAN 170/12, IAN 174/13, IAN 175/13, part of IAN 185/15)
Version 0.1.0
Summary
This document sets out the requirements for assessing and reporting the effects of highway projects on air quality.
National Variation
This document has associated National Application Annexes providing alternative or supplementary content to that given in the core document, which is relevant to specific Overseeing Organisations. National Application Annexes are adjoined at the end of this document.
Feedback and Enquiries
Users of this document are encouraged to raise any enquiries and/or provide feedback on the content and usage of this document to the dedicated National Highways team. The online feedback form for all enquiries and feedback can be accessed at: www.standardsforhighways.co.uk/feedback.
This is a controlled document.Latest release notes
| Document Code | Version number | Date of publication of relevant change | Changes made to | Type of change |
|---|---|---|---|---|
| LA 105 | 0.1.0 | June 2024 | Core document | Incremental change to requirements |
| LA 105 has been updated in part, to amend the requirements relating to Air Quality Barriers (Section 2). [Publication: June 2024] | ||||
Previous versions
| Document Code | Version number | Date of publication of relevant change | Changes made to | Type of change |
|---|---|---|---|---|
| LA 105 | 0 | November 2019 |
Foreword
Publishing information
This document is published by National Highways.
This document supersedes the following documents, which are withdrawn:
- HA 207/07;
- IAN 170/12;
- IAN 174/13;
- IAN 175/13.
This document supersedes the section of IAN 185/15 that covers air quality for the assessment of link speeds and generation of vehicle data into ‘speed-bands’.
Contractual and legal considerations
This document forms part of the works specification. It does not purport to include all the necessary provisions of a contract. Users are responsible for applying all appropriate documents applicable to their contract.
Introduction
Background
Projects can have significant air quality effects on human health and designated habitats and / or affect the UK's reported ability to comply with the 2008/50/EC [Ref 1.N] in the shortest timescales possible.
Effects can result from the project itself (alone) or in combination with other plans or projects.
This document provides a framework for assessing, mitigating and reporting the effects of motorway and all-purpose trunk road projects on air quality by:
- determining whether the impacts of a project on human health or designated habitats can trigger a significant air quality effect;
- determining whether the impacts of a project affects the UK's reported ability to comply with the 2008/50/EC [Ref 1.N] in the shortest timescales possible;
- determining whether construction activities associated with the delivery of the project triggers a significant air quality effect on nearby sensitive receptors;
- assessing and applying the appropriate mitigation measures and air quality monitoring where a project:
-
- triggers a significant air quality effect;
- affects the UK's reported ability to comply with the 2008/50/EC [Ref 1.N] in the shortest timescales possible; or,
- results in adverse dust impacts.
This document aligns with Directive 2011/92/EU as amended by 2014/52/EU (hereafter referred to as the EIA Directive).
Assumptions made in the preparation of this document
The assumptions made in GG 101 [Ref 7.N] apply to this document.
Abbreviations
| Abbreviation | Definition |
|---|---|
| AADT | Annual average daily traffic |
| AAWT | Annual average weekday traffic |
| AM | Ante meridiem (morning) |
| APIS | Air Pollution Information Service |
| AQD | Air Quality Directive |
| AQMA | Air quality management area |
| AQS | Air quality strategy |
| ARN | Affected road network |
| EMP | Environmental management plan |
| Defra | Department for Environment, Food and Rural Affairs |
| DfT | Department for Transport |
| EFT | Emission factor toolkit |
| EU | European Union |
| HDV | Heavy duty vehicles |
| IP | Inter peak period (day) |
| JAQU | Joint air quality unit |
| kg/ha/year | kilograms per hectare per year |
| LAQM | Local air quality management |
| N | Nitrogen |
| NO2 | Nitrogen dioxide |
| NOx | Oxides of nitrogen |
| OP | Overnight period |
| PAQAP | Project air quality action plan |
| PCM | Pollution climatic mapping |
| PM | Post meridiem (evening) |
| PM10 | Particulate matter of 10 microns or less |
| PM2.5 | Particulate matter of 2.5 microns or less |
| SAC | Special area of conservation |
| SPA | Special protection area |
| TRA | Traffic reliability area |
| v/c | Volume capacity |
Terms and definitions
| Term | Definition |
|---|---|
| Affected road network | All roads that trigger the traffic screening criteria and adjoining roads within 200 m |
| Air quality management area | An area declared by a local authority which has been determined will exceed the relevant air quality strategy objective |
| Air quality threshold | Generic term to represent the relevant pollutant averaging period and concentration value described by the air quality strategy objectives or EU limit values |
| Annual average daily traffic | A description of daily traffic characteristics for the representative average 7 day period (Monday to Sunday) |
| Annual average weekday traffic | A description of daily traffic characteristics for the representative average weekday period only (Monday to Friday) |
| Base year traffic data | The outputs of the traffic model coinciding with the year the traffic data was collected |
| Clean air zone | A defined area where specific measures are identified to improve air quality to support attainment of the EU limit values in the shortest timescales possible |
| Competent expert for air quality | Individuals who can demonstrate that they have relevant:
|
| Competent expert for biodiversity | Individuals who can demonstrate that they have relevant:
|
| Competent expert for traffic | Individuals who can demonstrate that they have relevant:
|
| Designated habitats | Internationally, nationally and locally designated sites of ecological conservation importance on protected species and on habitats and other species identified as being of principal importance for the conservation of biodiversity |
| Do minimum | The scenario that represents the situation that would occur without the project in operation, which includes permitted developments |
| Do something | The scenario that represents the situation that would occur with the project in operation, which includes permitted developments |
| Evening peak period (PM) | Period of time representing traffic characteristics in the evening, normally between 4PM and 7PM |
| Inter peak period (IP) | Period of time representing traffic characteristics during the day, normally between 10AM and 4PM |
| Local air quality | Assessment of the impact of pollutant concentrations on sensitive receptors within 200 m of a road. |
| Low emission zone | A defined area where access by some polluting vehicles is restricted or deterred with the aim of improving the air quality |
| Morning period (AM) | Period of time representing traffic characteristics in the morning, normally between 7AM and 10AM |
| Overnight period (OP) | Period of time representing traffic characteristics over night, normally between 7PM and 7AM |
| Opening year | First year of operation |
| Pollutant concentrations | Concentrations of pollutants normally reported as micrograms per cubic metre of air (µg/m3). |
| Pollution climatic mapping model | Government's national air quality modelling used to assess and report on compliance with the 2008/50/EC [Ref 1.N] to the European Commission |
| Project air quality action plan | The section of the air quality assessment where the proposed viable mitigation measures are set out and assessed |
| Projected base year | Represents the opening year of the project assessed with the vehicle emission rates for the base year to inform the assessment of future year projections of NOx and NO2 |
| Qualifying feature | This includes public access (such as a footpath) and sensitive receptors (such as residential properties, schools etc) within 15 m of the running lane/kerbside, but which are not within 25 m of a junction. |
| Sensitive receptor | Includes residential properties, back gardens, schools, hospitals, care homes, public open spaces, public access |
| Speed band | A range of categories for which outputs from the traffic model are grouped into to describe their emissions |
| Traffic reliability area | The traffic scoping criteria is only to be applied to the area covered by the traffic model, that the competent expert for traffic has identified as reliable for inclusion in an environmental assessment, and is referred to as the traffic reliability area. |
1. Scope
Aspects covered
1.1 The requirements in this document shall be applied to the assessment, reporting and management of impacts of air quality on human health and biodiversity from the delivery of motorway and all-purpose trunk road projects.
NOTE Where applicable, Overseeing Organisation-specific requirements for air quality are provided in the National Application Annexes.
1.2 The environmental assessment must, in line with the EIA Directive 2014/52/EU [Ref 3.N] identify, describe and assess the likely significant effects of proposed projects on the environment resulting from air quality impacts of the project.
1.3 The environmental assessment must identify, describe and assess the risk to affecting the UK's reported ability to comply with the 2008/50/EC [Ref 1.N]in the shortest timescales possible.
1.4 The environmental assessment shall identify, describe and assess the risk of dust arising from construction activities that have the potential to result in statutory nuisance.
1.5 Decommissioning associated with a proposed project shall be excluded from assessment of air quality due to the length of the asset operational phase.
NOTE The assessments of effects on air quality interact/overlap with assessments undertaken for the following factors:
- traffic;
- biodiversity (see LA 108 [Ref 4.N];
- climate, (see LA 114 [Ref 5.N]; and,
- population and human health (see LA 112 [Ref 11.N].
Implementation
1.6 This document shall be implemented forthwith on all projects involving the assessment of air quality on the Overseeing Organisations’ motorway and all-purpose trunk roads according to the implementation requirements of GG 101 [Ref 7.N].
Use of GG 101
1.7 The requirements contained in GG 101 [Ref 7.N] shall be followed in respect of activities covered by this document.
2. Assessment methodology
Scoping
2.1 The following traffic scoping criteria shall be used to determine whether the air quality impacts of a project can be scoped out or require an assessment based on the changes between the do something traffic (with the project) compared to the do minimum traffic (without the project) in the opening year:
- annual average daily traffic (AADT) 1,000; or
- heavy duty vehicle (HDV) AADT 200; or
- a change in speed band; or
- a change in carriageway alignment by 5 m.
NOTE 1 The AADT and HDV criteria are applied to the sum of carriageways and not individual carriageways.
NOTE 2 The 1,000 vehicles and 200 HDVs represent the lowest threshold above which the traffic model can represent change in traffic conditions to a reasonable level of confidence.
2.2 The air quality assessment shall be based on the most likely forecast of traffic flows.
NOTE There is no requirement to model other traffic growth sensitivity scenarios; for example high and low growth traffic scenarios.
2.3 The traffic scoping criteria shall only be applied to the area covered by the traffic model that the competent expert for traffic has identified as reliable for inclusion in an environmental assessment, and is referred to as the traffic reliability area (TRA).
2.3.1 The competent expert for traffic should work with the competent expert for air quality to ensure that the TRA covers those areas that are likely to be sensitive to changes in air quality, e.g. where there are:
- monitored exceedances of air quality thresholds;
- air quality management areas (AQMAs);
- areas identified by the Department for Environment, Food and Rural Affairs (Defra) as exceeding EU limit values; and/or
- designated habitats.
NOTE Where applicable, Overseeing Organisation-specific requirements for air quality are provided in the National Application Annexes.
2.4 The traffic and air quality competent experts shall agree the study area to be included in the air quality assessment.
2.5 A statement shall be included in the assessment detailing how the study area was defined and that the TRA is appropriate for the air quality assessment.
2.6 Where the project does not lead to a change in any of the traffic scoping criteria then an air quality assessment shall not be required and can be scoped out.
2.7 Where the air quality assessment is scoped out, a statement shall be provided stating that the traffic scoping criteria have not been triggered and consequently there was no requirement for an air quality assessment.
2.8 Where a project triggers the traffic scoping criteria, a figure shall be prepared depicting all the roads that meet these criteria, and all roads with modelled traffic data within 200 m of these roads.
NOTE All roads that trigger the traffic screening criteria, and adjoining roads within 200 m, is defined as the affected road network (ARN).
2.9 Once the need for an assessment has been concluded, the type of assessment, either a simple or detailed assessment, shall be determined.
2.10 The flow chart in Figure 2.10 shall be used to determine whether a simple or detailed air quality assessment is required and the level of assessment is determined by the level of risk and the stage of assessment for a project.
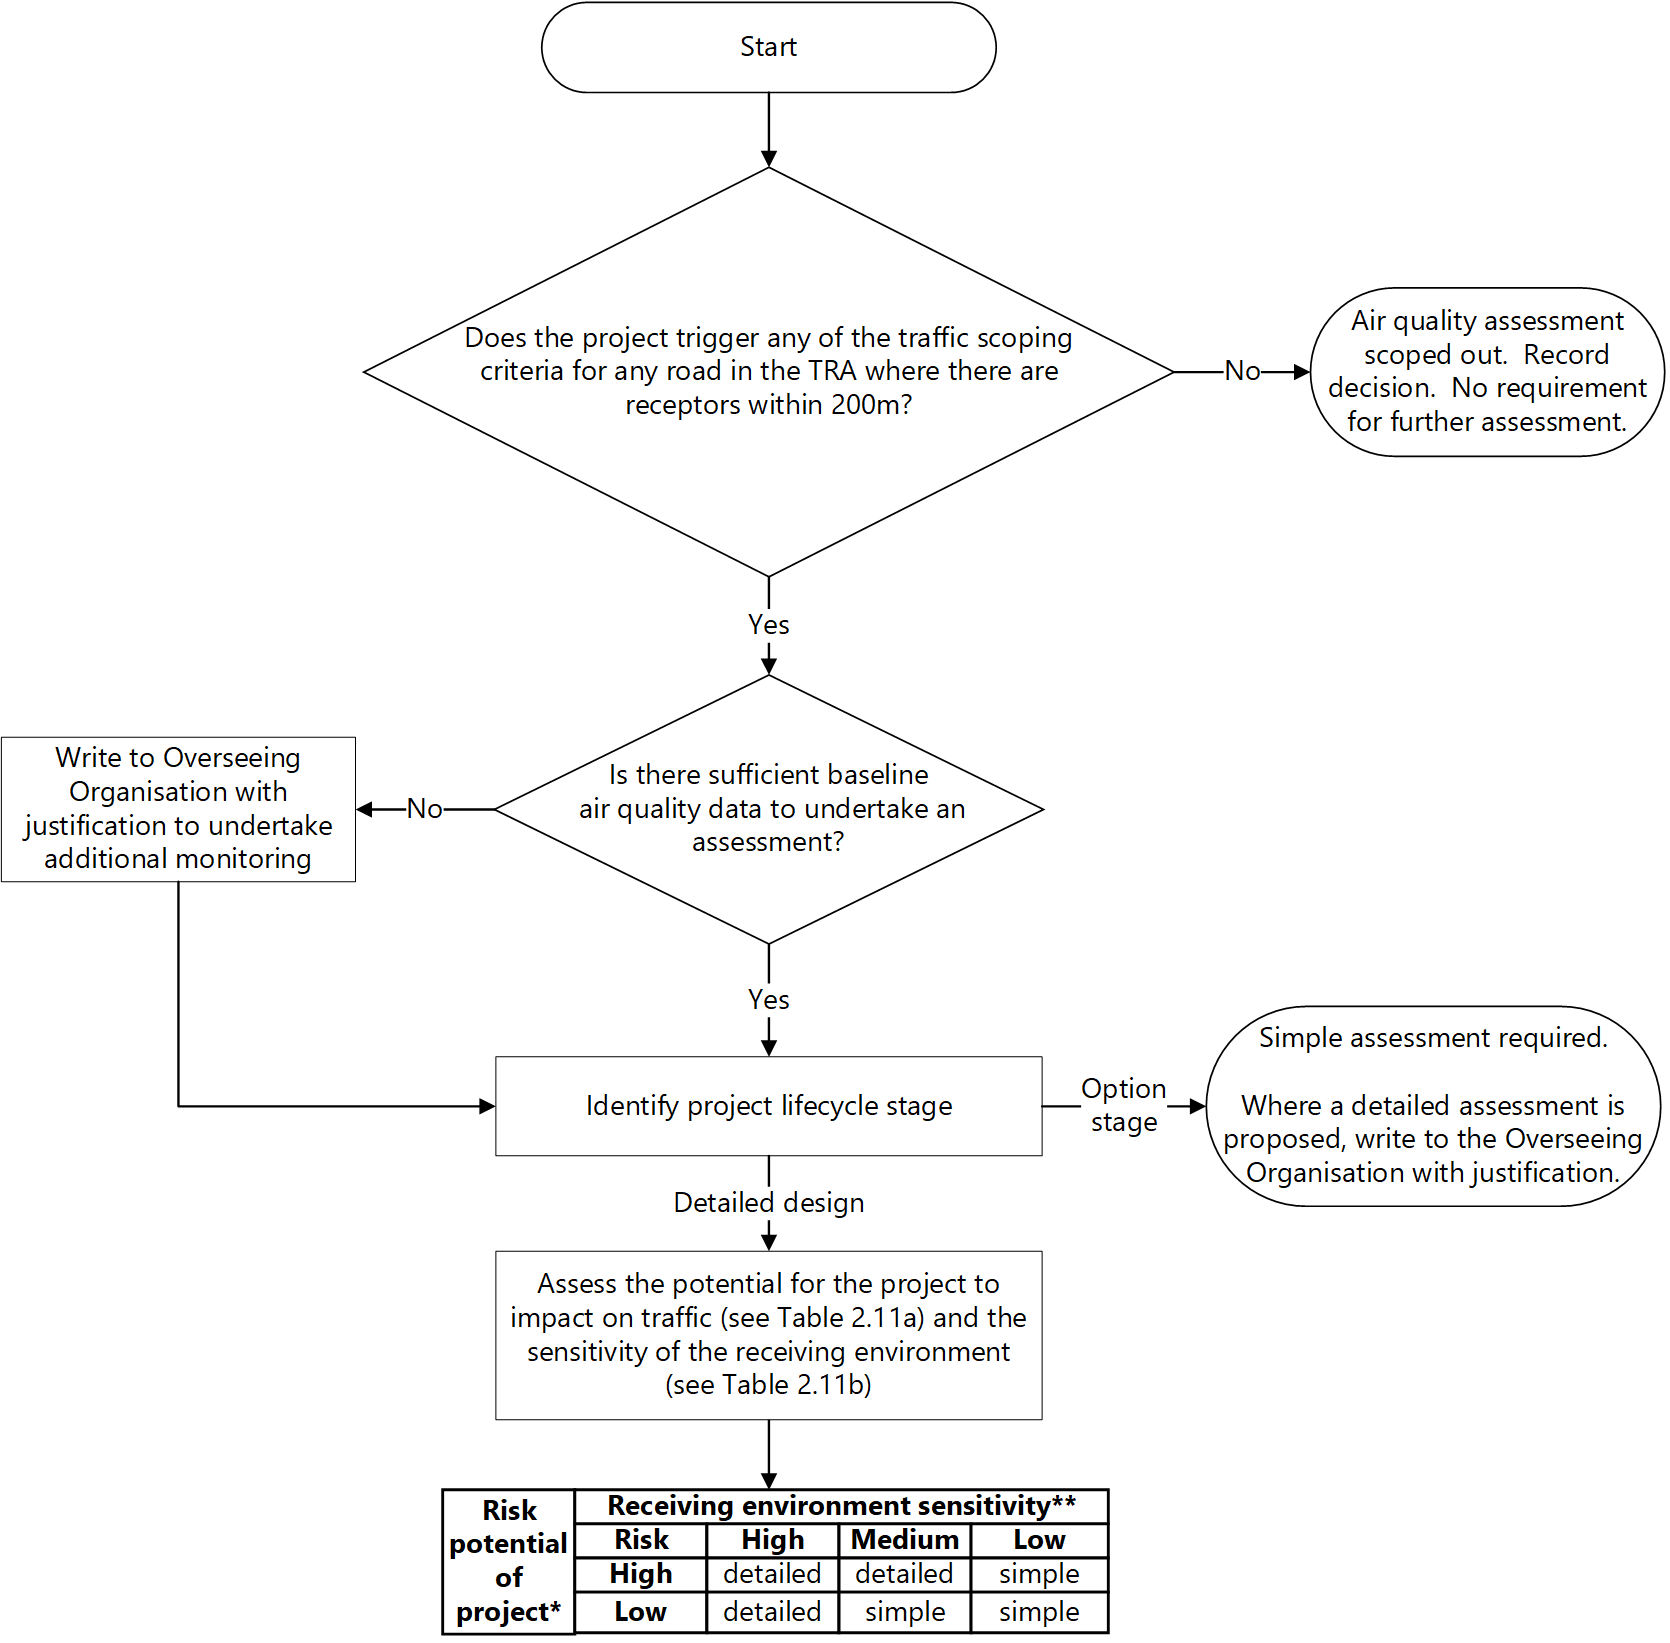
2.10.1 The level of assessment is determined by the level of risk and the assessment stage for the project, and at the options selection and preliminary design stages a simple assessment should be sufficient.
NOTE 1 A simple assessment provides sufficient information to confirm that the project does not result in any exceedances of the air quality thresholds.
NOTE 2 A detailed level of assessment is more likely where there is a risk of exceeding air quality thresholds and for the detailed design stage of the project lifecycle.
2.11 Tables 2.11a and 2.11b shall be used in conjunction with the flowchart in Figure 2.10 to determine a project's risk potential, and whether a simple or detailed air quality assessment is undertaken.
| Risk | Project examples |
|---|---|
| High |
|
| Low |
|
| Sensitivity | Features of receiving environment |
|---|---|
| High |
|
| Medium |
|
| Low |
|
NOTE Low risk projects are likely to result in traffic changes that are localised to the project and high risk projects are likely to impact traffic flows over a much wider area.
2.12 Where monitoring data evidence is used to inform the risk to the receiving environment, a competent expert for air quality shall determine whether there is a sufficient coverage of monitoring sites or if additional monitoring sites are required.
2.13 Table 2.13 includes the requirements for traffic, air quality modelling and receptors that shall be included in the simple and detailed assessment.
| Simple assessment | Detail assessment | |
|---|---|---|
| Traffic input |
|
|
| Air quality modelling |
|
|
| Receptors |
|
|
2.14 The competent expert for air quality shall consult the Overseeing Organisation if a detailed assessment is being proposed at options selection and preliminary design stage, with a justification for this approach.
Baseline
Air quality data
2.15 The following baseline information shall be gathered to inform the air quality assessment:
- air quality monitoring data such as obtained from local authority, Defra, and the Overseeing Organisation;
- local authority air quality reports including the locations of any AQMAs within, or close to, the border of the ARN;
- local authority air quality action plans (AQAPs);
- information regarding compliance with the EU Directive, zonal / agglomeration exceedance status including local air quality plans prepared to support the Government's National Air Quality Plan for achieving compliance with the 2008/50/EC [Ref 1.N];
- pollution climatic mapping (PCM) modelled concentrations that coincide with roads included in the ARN;
- background maps for NOx concentrations and nitrogen deposition, where designated habitats are included in the assessment; and,
- planning applications for any future developments that could introduce new receptors that could be affected by the project in the opening year.
2.16 Where it is identified that additional project-specific baseline air quality monitoring is required following the review of the baseline information, this shall be justified to and agreed with the Overseeing Organisation prior to any monitoring being deployed.
2.17 Monitoring data shall be provided to the Overseeing Organisation on a quarterly basis throughout the monitoring period.
Air quality modelling
Selecting sensitive receptors - human health
2.18 Sensitive receptors shall be chosen within 200 m of the ARN and include residential properties, schools and hospitals for the assessment of annual mean air quality thresholds.
2.19 Where there is a risk of the short term air quality thresholds being exceeded then sensitive receptors locations including gardens and playing fields shall be assessed.
NOTE Sensitive receptors are defined in Defra's local air quality management technical guidance (LAQM) TG 16 [Ref 8.N].
2.20 Representative sensitive receptors shall be chosen to ensure that those receptors with the highest pollutant concentrations (closest to the road, junctions, etc.) or anticipated to experience highest level of change (next to roads within the ARN with the largest change in the traffic screening criteria) are included in the air quality assessment.
2.21 Where exceedances of the air quality thresholds are predicted at the representative sensitive receptors in the air quality modelling, additional sensitive receptors shall be included in the air quality modelling to capture all sensitive receptors with exceedances in either the do minimum or do something scenarios.
2.21.1 There should be no need to model all receptors within 200 m, or an excessive number of receptors in the same area, to determine whether there is likely to be any exceedances in the do minimum or do something scenarios.
2.21.2 It should only be necessary to model PM10 for the base year to demonstrate that there is no impact on achievement of the PM10 air quality thresholds as a result of the project.
2.21.3 Where the air quality modelling indicates exceedances of the PM10 air quality thresholds in the base year then PM10 should be included in the air quality model in the do minimum and do something scenarios.
2.21.4 There should be no need to model PM2.5 as the UK currently meets its legal requirements for the achievement of the PM2.5 air quality thresholds, and the modelling of PM10 can be used to demonstrate that the project does not impact on the PM2.5 air quality threshold.
NOTE There are very few areas in the UK outside of London that exceed the air quality thresholds for particulate matter (PM10 or PM2.5).
Selecting qualifying features - compliance risk assessment
2.22 The compliance risk assessment shall only be undertaken on the roads identified in the PCM model which are within the ARN.
2.23 The assessment shall identify areas with qualifying features on the PCM road network that meet Defra's interpretation of the 2008/50/EC [Ref 1.N].
NOTE 1 Qualifying features include public access (footpath for example) and sensitive receptors (such as residential properties, schools) within 15 m of the running lane/kerbside, but are not within 25 m of a junction.
NOTE 2 Where applicable, Overseeing Organisation-specific requirements for air quality are provided in the national application annexes to this document.
2.24 Sensitive receptors shall be chosen within 15 m of the ARN and include residential properties, schools, hospitals, and public access for inclusion in the compliance risk assessment for the assessment of annual mean EU limit values.
Selecting sensitive receptors - designated habitats
2.25 Internationally, nationally and locally designated sites of ecological conservation importance on protected species and on habitats and other species identified as being of principal importance for the conservation of biodiversity (known as designated habitats), within 200 m of the ARN, shall be included in the air quality assessment.
NOTE Designated habitats include ‘Ramsar’ sites, special protection areas, special areas of conservation, sites of special scientific interest, local nature reserves, local wildlife sites, nature improvement areas, ancient woodland and veteran trees.
2.26 For each designated habitat, transect receptor points at 10-m intervals shall be modelled, starting from the nearest point of the designated habitat to the road, up to a maximum distance of 200 m regardless of whether the habitat extends beyond 200 m.
2.26.1 Only sites that are sensitive to nitrogen deposition should be included in the assessment. (It is not necessary to include sites, for example, that have been designated as a geological feature or water course.)
Traffic data requirements
2.27 The traffic data used shall be proportionate to the level of the air quality assessment.
2.27.1 For options selection and preliminary design stage or simple air quality assessment, AADT/AAWT traffic data should suffice.
2.27.2 For a detailed air quality assessment, traffic split by the four periods, morning (AM), inter peak (IP), evening peak (PM) and overnight period (OP) should suffice.
2.27.3 It should not be necessary to model weekend traffic conditions unless there is a specific requirement for the project and a weekend traffic model has been produced.
2.27.4 The Overseeing Organisation should be contacted for a copy of the traffic data template, which sets out the required traffic data format to undertake the air quality assessment.
NOTE 1 It is not necessary to incorporate diurnal profiles into the AADT traffic flows, period flows can be used in preference as they include different flow profiles (total and percentage heavy duty vehicles) and speeds.
NOTE 2 The competent expert for traffic can advise on the hours that are most representative of the various periods used in the air quality assessment.
Choice of air quality model
2.28 The most appropriate air quality model shall be used to complete the air quality assessment.
2.28.1 The DMRB air quality spreadsheet, which is available from the Overseeing Organisation, may be used for early option appraisal and simple air quality assessments.
2.28.2 A detailed dispersion air quality model may be used in instances that require the modelling of complex motorway junctions or for detailed air quality assessments.
Speed band emission factors
2.29 The pivoted speeds shall be allocated a speed band. There are four speed bands for urban roads and four speed bands for motorways.
2.30 The method specified in Appendix A shall be used to to generate the speed bands from the traffic model.
2.31 The air quality model shall use the latest speed banded emission factors which are available from the Overseeing Organisation.
NOTE The speed band emissions tool is to be updated when a new version of the emission factor toolkit is released.
2.32 The emission factors corresponding to each speed band provided from the traffic data shall be used in the air quality model.
NOTE In addition to speed bands for normal driving conditions, speed bands have also been generated for speed management interventions, including 70 mph and 60 mph speed management options.
2.33 Where speed management mitigation measures are included in the project air quality action plan (PAQAP), they shall only be applied to motorways and dual carriageways where they operate at high speed driving conditions.
2.34 Where AADT or AAWT traffic information is used to undertake the assessment, the AADT or AAWT speed shall be used to identify the relevant speed band.
2.35 Where mainline motorway links are identified as being in the heavy congestion speed band category, then a check shall be undertaken by a competent expert for traffic of the observed speeds to ensure that the evidence supports the selection of this speed band.
2.35.1 Within a 100-m radius of the centre of the junction on an urban/rural road in all directions should be assigned the light congestion speed band, but there can be instances when the heavy congestion speed band is a better representation of the traffic conditions.
2.36 Only areas around junctions identified as sensitive to changes in air quality that can result in exceedances of air quality thresholds shall be assessed in greater detail.
NOTE It is recommended that a proportionate approach is adopted when splitting the traffic model links into more detail around junctions.
2.37 Emissions on motorway entry slip roads shall be set to heavy congestion.
2.38 Emissions on motorway exit slip roads shall be set to free flow.
NOTE Emissions on motorway entry and exit slip roads can be significantly different due to vehicle dynamics and emissions can be much higher for vehicles using entry slip roads as they accelerate to join the mainline, where as engine load is much lower on exit slip roads as vehicles slow for the junction.
Calculation of road NOx
2.39 The air quality assessment shall include predictions for the base year, do minimum and do something scenarios, in the opening year.
2.39.1 The modelling should take account of the latest version of Defra's Local Air Quality Management Technical Guidance TG 16 [Ref 8.N].
2.40 Road NOx concentrations shall be calculated for each of the identified sensitive receptors for the base year, and do minimum and do something in the opening year.
2.41 For each designated habitat, modelled road nitrogen oxides (NOx) concentrations shall be calculated at the identified transect receptor points, for the base year, and do minimum and do something in the opening year.
2.42 The road NOx concentration shall be converted to nitrogen dioxide (NO2) using the latest published version of Defra's air quality tools LAQM [Ref 9.N] including the background pollutant maps and NOx to NO2 conversion spreadsheet.
Calculation of nitrogen deposition
2.43 For each point along a transect, the road NOx concentration shall be converted to road NO2, for the base year, and do minimum and do something in the opening year.
2.44 The road NO2 shall be converted to dry nutrient nitrogen (N) deposition rate (kg N/ha/yr).
2.44.1 The following conversion rates of NO2 concentrations (1 ) to N deposition kg N/ha/yr taken from the air quality advisory group guidance document AQTAG06 [Ref 2.I] should be used for:
- grassland and similar habitats: 1 of NO2 = 0.14 kg N/ha/yr;
- forests and similar habitats: 1 of NO2 = 0.29 kg N/ha/yr.
2.44.2 The following conversion rates of NO2 concentrations (1) to N deposition kg N/ha/yr taken from the air quality advisory group guidance document should be used for:* grassland and similar habitats: 1 of NO2 = 0.14 kg N/ha/Yr;* forests and similar habitats: 1g/m3 of NO2 = 0.29 kg N/ha/yr.
NOTE Wet deposition does not need to be considered for the assessment of road projects as this is not significant for short range emissions such as those emitted from vehicles.
2.45 The road N deposition rate for the base year, do minimum and do something in the opening year shall be added to the background N deposition for each point along the transect.
2.46 The source for the background nitrogen deposition rate shall be recorded in the air quality assessment.
2.46.1 The background nitrogen deposition rate may be obtained from the air pollution information system (APIS) (see APIS (website) [Ref 1.I]) for the relevant designated habitat.
NOTE The N deposition rates from the APIS background maps can be used as published, and there is no requirement to remove road components from the background maps.
Addressing uncertainty in predicted future roadside nitrogen dioxide concentrations
2.47 Once the air quality modelling has been completed for the project, adjustments to the verified modelled nitrogen dioxide concentration shall be made to account for future roadside NO2 concentrations.
2.48 To ensure that the modelled roadside NO2 concentrations are not too optimistic, an additional scenario (hereafter referred to as the projected base year) shall be included in the air quality modelling to enable a gap analysis to be completed.
NOTE The gap analysis is the application of adjustment factors which take into consideration the assumed roadside rates of reduction in NOx and NO2 by Defra's modelling tools compared to observed roadside monitoring trend; that is the gap between the predicted reductions and those observed.
2.49 The projected base year scenario (using the base year traffic data) shall be modelled using the opening year vehicle emission factors and opening year background concentrations and an example of the data requirements are shown in Table 2.49.
| Scenario | Traffic data | Vehicle emissions | Background concentrations |
|---|---|---|---|
| Base year | 2015 | 2015 | 2015 |
| Projected base year | 2015 | 2025 | 2025 |
| Do minimum | 2025 | 2025 | 2025 |
| Do something | 2025 | 2025 | 2025 |
2.50 Total NO2 concentrations for the projected base year scenario shall be calculated and verified using the same approach as the base year and opening year air quality models.
2.51 Individual gap factors shall be calculated for each modelled receptor using the following approach:
- collate the modelled total NO2 concentrations for the base year, projected base year, do-minimum and do-something in the opening year;
- divide the modelled projected base year NO2 concentration by the modelled base year NO2 concentration (ratio A);
- use the long-term annual projection factors for annual mean NO2 concentrations between the base year and opening year, i.e. opening year projection factor divided by the base year projection factor (ratio B); and,
- calculate the gap factor by dividing ratio B by ratio A.
2.52 The gap factor for each receptor shall be applied to the modelled opening year do minimum and do something NO2 concentrations as illustrated in Table 2.52.
| Receptor | 2015 Base year | Projected base year 2025 |
DM 2025 | DS 2025 | Ratio A (projected base year /base year) |
Ratio B | Gap factor (Ratio B / Ratio A) |
2025 DM (Do minimum x Gap factor) |
2025 DS (Do something x Gap factor) |
|---|---|---|---|---|---|---|---|---|---|
| R1 | 45.3 | 26.8 | 27.8 | 27.9 | 0.59 | 2025 Factor / 2015 Factor | 1.22 | 33.9 | 34.0 |
NOTE The Overseeing Organisation has developed a spreadsheet to be used in this process to undertake the gap analysis which is available on request.
2.53 The results using the gap analysis methodology shall form part of the assessment significant air quality effect.
2.54 The compliance risk assessment shall use the results from the Defra methodology so the assessment is consistent with Defra's reporting on compliance with the EU limit values.
2.55 Where the gap factor is either too conservative or too optimistic when compared to local monitoring trends, justification for the deviation from the published gap factor shall be clearly laid out and evidenced in the assessment.
NOTE Evidence supporting such a decision would be primarily based on the trend in air quality monitoring data from monitoring sites local to the project.
Construction assessment
Dust
2.56 The construction dust assessment shall determine the construction dust risk potential of the project to the receiving environment, which informs the appropriate level of mitigation.
2.57 All sensitive receptors (human and designated habitats) within 0-50 m, 50-100 m and 100-200 m of all construction activity shall be identified on a constraints plan.
2.58 Tables 2.58a and 2.58b shall be followed to determine whether the project has a high or low construction dust risk.
| Risk | Examples of the types of project |
|---|---|
| Large | large smart motorway projects, bypass and major motorway junction improvements. |
| Small | junction congestion relief project i.e. small junction improvements, signalling changes. short smart motorway projects. |
| Construction dust risk potential | Distance from construction activities | ||
|---|---|---|---|
| 0- 50 m | 50 - 100 m | 100 - 200 m | |
| Large | High | High | Low |
| Small | High | Low | Low |
2.59 The construction dust risk potential shall be used to inform the measures required to support the proposed mitigation.
Construction traffic
2.60 The impact of construction activities on vehicle movements shall be assessed where construction activities are programmed to last for more than 2 years.
NOTE If the construction activities are less than 2 years it is unlikely that the construction activities would constitute a significant air quality effect or impinge on the UK's reported ability to comply with the 2008/50/EC [Ref 1.N] given the short-term duration of the construction activities as opposed to the long-term operation of the project.
2.61 The traffic scoping criteria shall be used to determine whether changes in traffic as a consequence of construction activities require further assessment.
2.62 The assessment of construction traffic impacts on sensitive receptors shall be proportionate and limited to the areas of key risk of exceeding air quality thresholds.
Operational assessment
2.63 The outputs of the air quality modelling shall inform the compliance risk assessment and the local air quality assessment (impact of the project on human and designated sites) to determine whether the project leads to a significant air quality effect.
Compliance risk assessment
2.64 The competent expert for air quality shall determine whether a project affects UK's reported ability to comply with the 2008/50/EC [Ref 1.N] in the shortest timescales possible and inform whether the project triggers a significant air quality effect.
2.65 The assessment shall use the latest reported information from Defra’s Pollution Climate Mapping (PCM) model Modelled air quality data [Ref 10.N] , local authority's air quality plans and the modelled NO2 concentrations from the project's air quality assessment.
NOTE 1 The PCM network includes the roads that Defra model for reporting whether a zone/agglomeration they reside within complies with the EU limit values.
NOTE 2 For the purposes of assessment and reporting, the UK is divided into 43 zones and agglomerations (hereafter referred to as zones) and a zone becomes compliant when everywhere in the zone is below the EU limit values.
2.66 The compliance risk assessment shall be based on identifying areas that have qualifying features that meet Defra's interpretation of the 2008/50/EC [Ref 1.N], which include public access (such as a footpath) and sensitive receptors (residential properties, schools, as examples) that are within 15 m of the running lane/kerbside, but are not within 25 m of a junction.
NOTE The annual mean EU limit value applies at the qualifying feature as set out in Defra's technical guidance on producing local plans for the purposes of assessing compliance with the Air Quality Directive.
2.67 The road links in the PCM model that reside within the extents of the ARN for the project shall be identified.
2.67.1 The PCM model is not always a perfect match and the professional judgement of a competent expert for air quality should be applied to align the PCM model road network to the roads included in the ARN.
2.68 Where none of the road links from the PCM model coincide with the ARN a compliance risk assessment is not required and shall be scoped out and a statement provided stating that, "There are no road links from the PCM model in the study area for the project and therefore the project does not affect the UK's reported ability to comply with the 2008/50/EC [Ref 1.N] in the shortest timescales possible."
Assessment
2.69 For each PCM link within the ARN a review shall be undertaken to determine the location of qualifying features i.e. a sensitive receptor or public access within 15m of the edge of the running lane (excludes the hard shoulder) / kerbside, and outside of 25m of a junction.
2.69.1 In relation to public access, footpaths that are perpendicular to the road (pedestrian crossings, footbridges or pedestrian tunnels across, under or over the road) these should not be considered, as public exposure would be minimal in these locations, and Defra has advised that they are not to be included in the compliance assessment.
2.70 The area 25 m around junctions shall be excluded from the compliance risk assessment, irrespective of whether there are any sensitive receptors or public access within 15 m of the edge of the roads within the junction.
NOTE 1 For major motorway junctions the area is defined as 25 m from the end of the slip road.
NOTE 2 For non-motorway junctions a “major junction” is defined as a junction which interrupts the traffic flow on the road and includes, for example, traffic-light-controlled junctions.
2.71 A figure showing the PCM road network and the qualifying features modelled for the compliance risk assessment shall be reported in the environmental assessment.
2.72 If there are no qualifying features within 15 m of the running lane and not within 25 m of a junction, along the length of the PCM link, then no further assessment for the PCM link shall be undertaken; this conclusion is to be recorded in the environmental assessment.
2.73 Where there are qualifying features along the PCM link the air quality model used for the project shall be used to model NO2 concentrations for:
- the nearest qualifying feature along each PCM link where concentrations are highest; and,
- a 4-m point from the running lane in the same location as the qualifying feature for comparison against the national PCM modelled point.
Local model 4-m point validation
2.74 The 4-m model results from the project modelling shall be tabulated to include the PCM road census ID, and the modelled NO2 concentration from either the PCM model or local authority local air quality plan for the base year for comparison against the PCM model.
2.75 The 4-m point shall be used to determine whether the air quality for the project aligns with the PCM outputs from the national model corresponding to the opening year of the project.
2.75.1 If there are significant differences between the two modelled values at the 4-m point (i.e. greater than 10%), where there are modelled exceedances in either data set, the inputs into the local model used for the project should be investigated to ensure that the outputs of the project's traffic and air quality modelling are robust.
2.76 The output from this review of the 4-m modelling shall confirm that the traffic and the local air quality modelling for the project are robust, i.e. confirmation that the model verification is the most appropriate and the traffic data in that area has been appropriately validated.
2.77 The local air quality model predictions shall be used instead of the reported NO2 concentrations from the PCM model to inform the compliance risk assessment.
Assessment of compliance risk
2.78 The modelled concentrations in do minimum and do something for the project and the change in concentration in the opening year, the corresponding PCM road census ID, the modelled NO2 concentration from either the PCM model or local authority local air quality plan for the opening year shall be tabulated.
2.79 The flow chart in Figure 2.79 shall be followed to complete the compliance risk assessment.
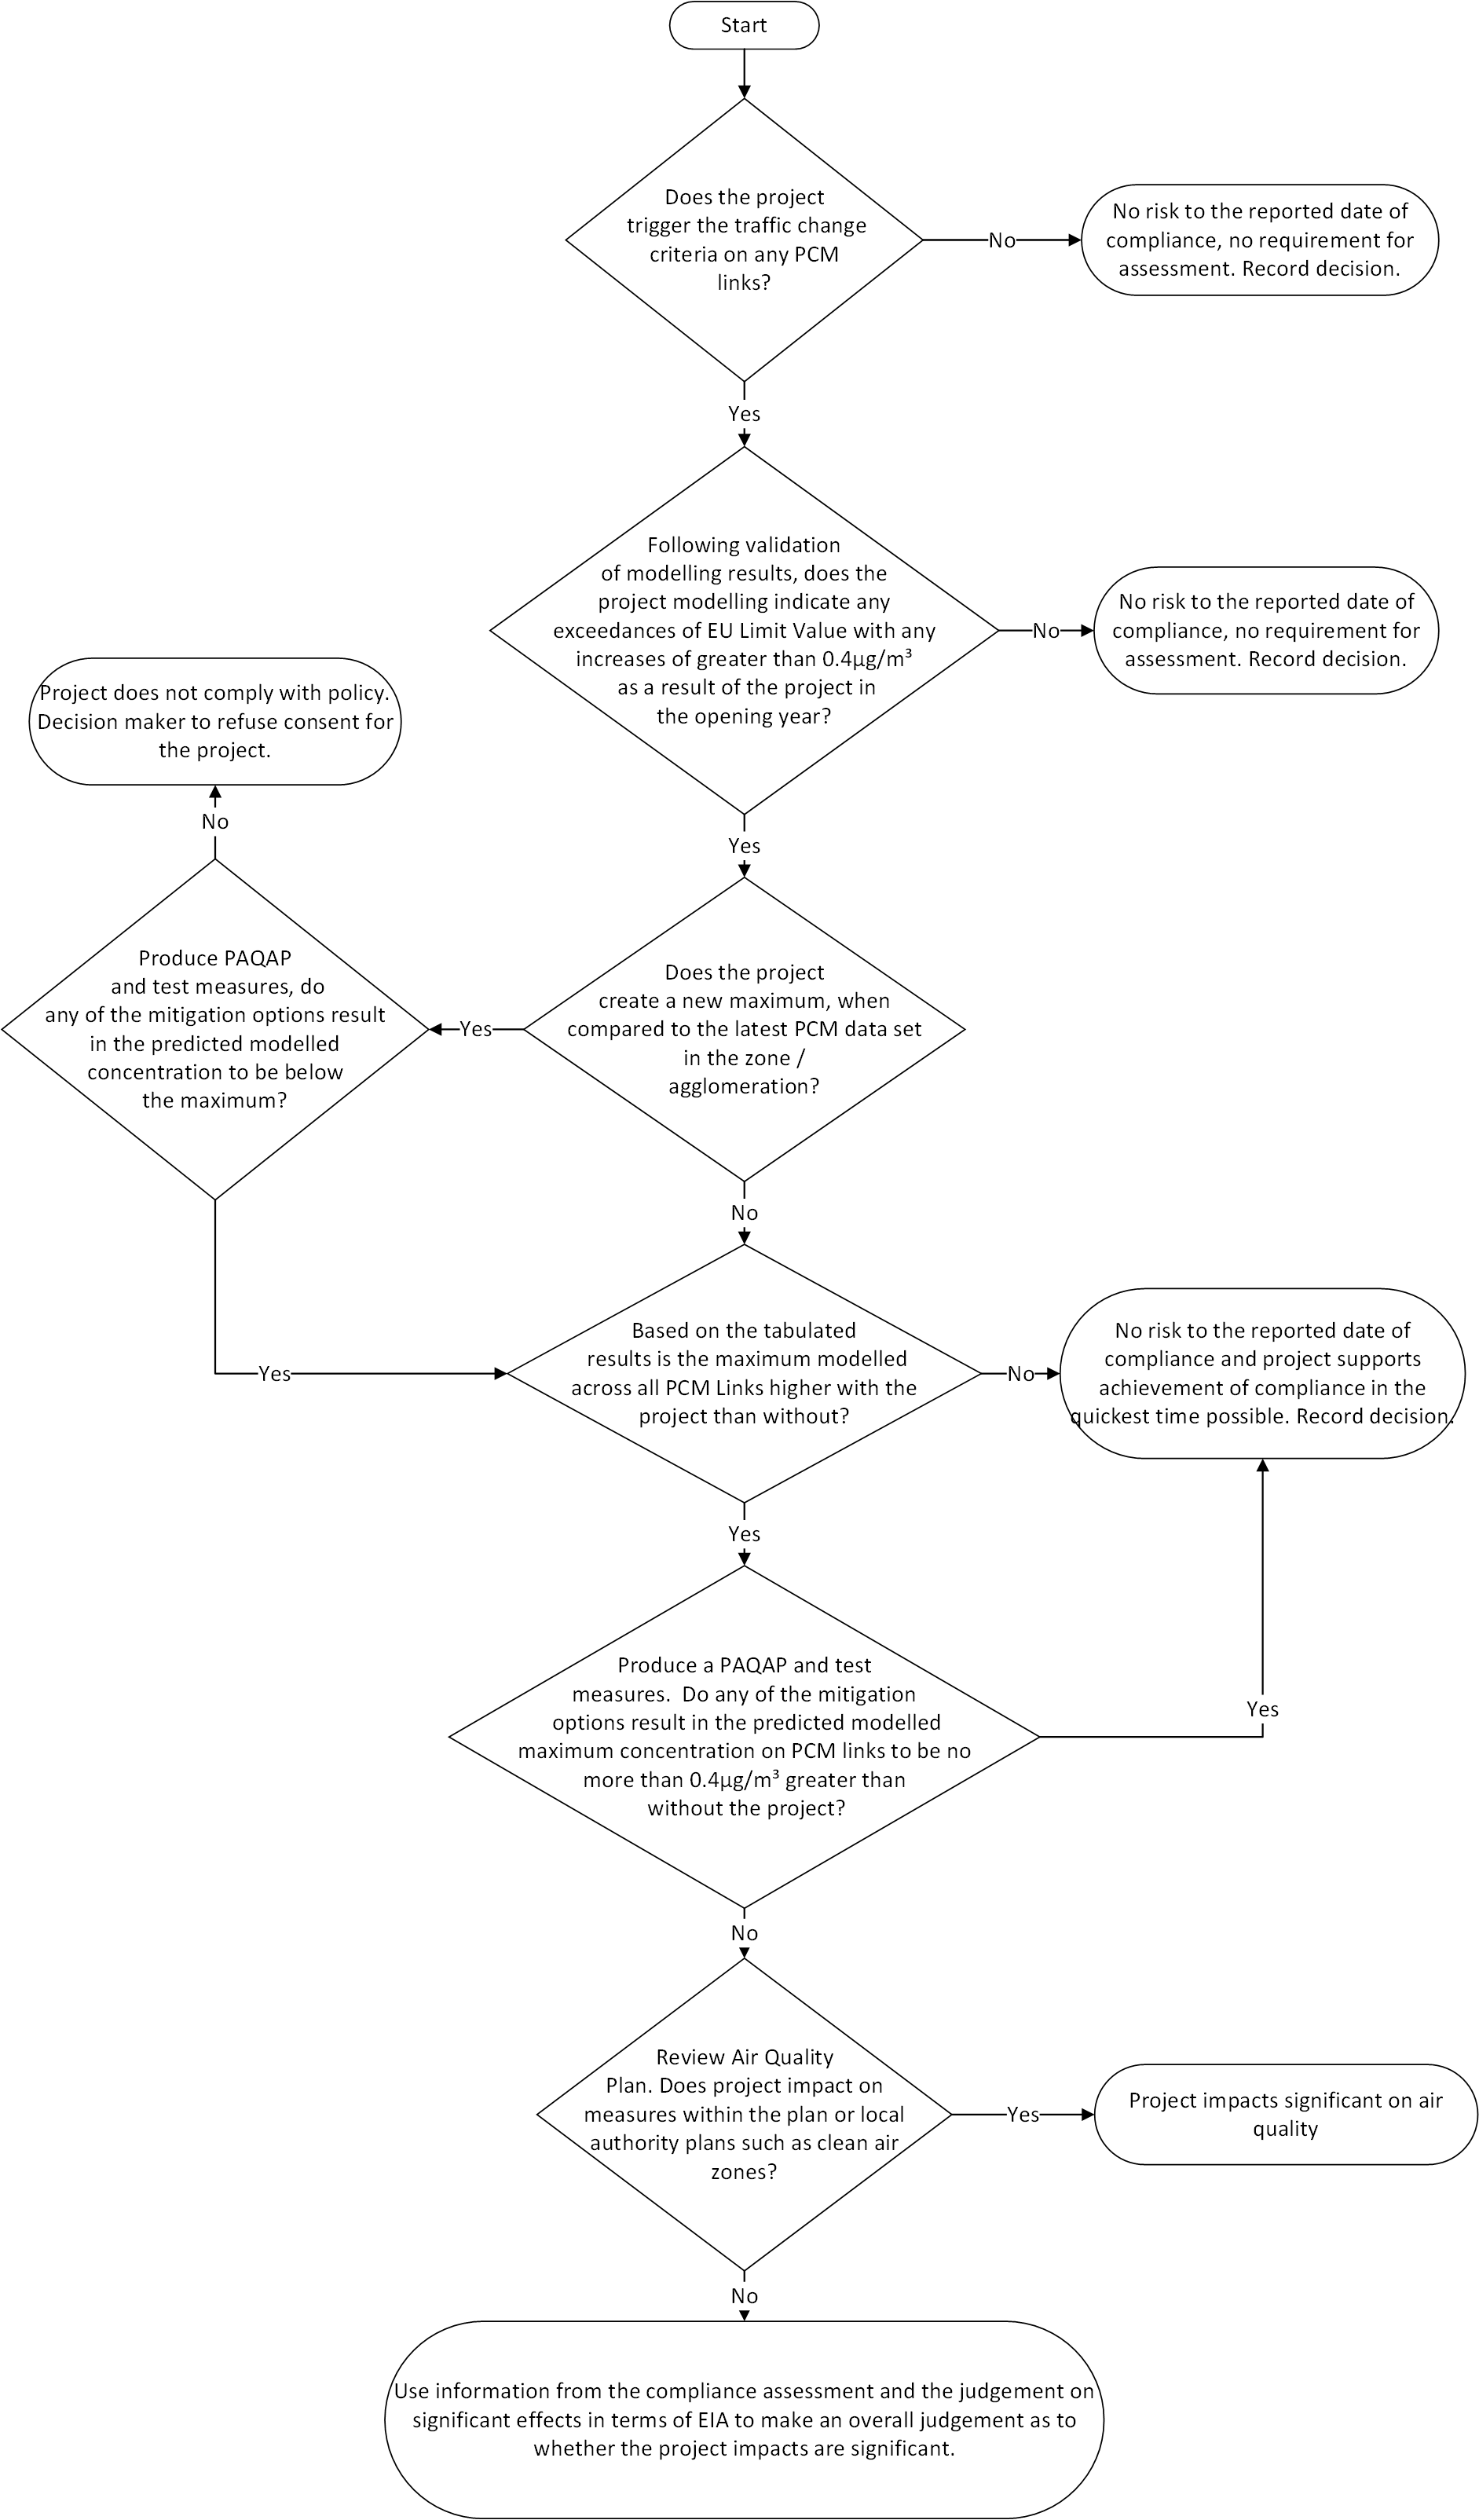
2.80 The assessment shall conclude there is no risk to the UK's reported ability to comply with the 2008/50/EC [Ref 1.N] in the shortest timescale possible where:
- there is no modelled exceedances of the air quality thresholds for any PCM link; or
- there are modelled exceedances of the air quality thresholds for any PCM link, but the change in annual mean NO2 concentrations between the do minimum and do something is less than or equal to +/-0.4 ; or,
- the project does not materially impact on measures within local air quality or national plans for the achievement of compliance.
NOTE 1 Local air quality plans developed for the purposes of achieving compliance in the shortest timescales possible are not the same as local air quality actions plans developed following the declaration of an air quality management area.
NOTE 2 A material impact on the plan is where the project causes a measure within the national or local plan to become non-deliverable and thereby having the potential to impact on the achievement of compliance in the shortest timescale possible.
2.81 A PAQAP shall be prepared describing the proposed mitigation measures as there is a risk to the UK's reported ability to comply with the Air Quality Directive in the shortest timescale possible where:
- the project causes a compliant zone to become non-compliant or delays compliance i.e. it creates a new maximum in any zone; or,
- the project materially impacts the delivery of measures set out in local authority local air quality plans.
2.82 Proposed viable mitigation measures shall be set out in the PAQAP to ensure the project:
- does not cause a compliant zone to become non-compliant, or delays compliance, otherwise the project cannot be progressed; and,
- does not materially impact the delivery of measures set out in local authority local air quality plans.
2.83 Additionally a PAQAP shall be produced where a project leads to a higher concentration at qualifying features with a change >0.4 in the do something compared to the do minimum.
NOTE If the maximum do something predicted modelled concentration is lower than in the maximum predicted do minimum concentration, overall the project is unlikely to delay compliance within the study area for the project.
2.84 If the proposed measures set out in the PAQAP do not reduce the impact to within 0.4 of the do minimum and/or there is worsening in air quality of >0.4 on any of the PCM links that exceed the EU limit value, the competent expert for air quality shall conclude whether this would trigger a significant air quality effect.
2.84.1 The competent expert for air quality should use the following criteria to establish whether a project triggers a significant air quality effect;
- the qualifying feature being affected e.g. little used/small section of footpath, heavily used footpaths (such as high streets with cafes etc), residential properties, school etc;
- the level of change in concentration as a result of the project and whether it is an overall worsening or improvement; and,
- the number of features being affected e.g. number of PCM links resulting in a deterioration in air quality as a result of the project.
2.84.2 The use of existing information and mapping collected for the project should provide information on likely use of public access and it is not envisaged that additional surveys are required.
Evaluating the outcomes of the compliance risk assessment
2.85 The concluding view of the risk to compliance with the 2008/50/EC [Ref 1.N] in the shortest timescales possible shall be reported in the environmental assessment.
2.86 The assessment shall summarise the evidence behind the conclusion as to whether the project has:
- affected the reported ability of the zone to comply with the latest reported timescales;
- caused a zone to be non compliant; and/or
- materially affected the national or local air quality plan in relation to achievement of compliance in the quickest time possible.
2.87 The outcomes of the compliance risk assessment shall inform the judgement of significant air quality effects.
Modelled / monitored exceedances not included in the PCM road network
2.88 Where the local air quality assessment for human health predicts air quality concentrations above the air quality thresholds, but do not coincide with the PCM road network or are more than 15 m away from a PCM link, the competent expert for air quality shall contact the Overseeing Organisation.
Human health
2.89 Table 2.91 shall be completed using the outputs from the air quality modelling for only those sensitive receptors where there are exceedances of the air quality threshold in either the do minimum and/or do something scenarios.
NOTE The difference in concentrations is the difference between the do something minus the do minimum modelled concentrations for each relevant receptor in the model year of the project, that is the worse case for air quality, which is normally the opening year.
2.90 A conclusion of no likely significant air quality effect for human health shall be recorded where the:
- outcomes of the air quality modelling for human health indicate that all concentrations are less than the air quality thresholds; and/or,
- difference in concentrations is imperceptible, that is less than 1% of the air quality threshold (e.g. 0.4 or less for annual mean NO2).
2.91 Where changes in concentrations are greater than 1% of the air quality threshold at qualifying receptors, then each receptor shall be assigned to one of the six boxes in Table 2.91.
| Magnitude of change in annual mean NO2 or PM10 (μg/m (μg/ m3) | Total number of receptors with: | |
| Worsening of an air quality at sensitive receptor above the air quality threshold or the creation of a new exceedance | Improvement of an air quality at sensitive receptor above the air quality threshold or the removal of an existing exceedance | |
| Large (>4) | ||
| Medium (>2) | ||
| Small (>0.4) | ||
| Total change | Sum of above | Sum of above |
NOTE Receptors can reside within more than one magnitude of change category; for example a receptor with a greater than 4 g/m³ change also resides within the medium (>2 g/m³) and small (>0.4 g/m³) categories, and this is to ensure that the aggregated number of properties are compared to the guideline bands.
2.92 The magnitude of change criteria shall not be assigned to individual receptors in the reported table of results for the project.
NOTE Table 2.92N presents framework guideline bands on the number of receptors for each of the magnitude criteria that might result in a significant air quality effect.
| Magnitude of change in annual mean NO2 or PM10 (μg/m3) | Total number of receptors with: | |
|---|---|---|
| Worsening of an air quality objective already above the objective or the creation of a new exceedance | Improvement of an air quality objective already above the objective or the removal of an existing exceedance |
|
| Large (>4) | 1 to 10 | 1 to 10 |
| Medium (>2) | 10 to 30 | 10 to 30 |
| Small (>0.4) | 30 to 60 | 30 to 60 |
2.93 The guideline bands shall be used to inform whether the project triggers a significant air quality effect.
2.93.1 Whilst the guideline bands have been provided, they should be a guide as to whether the project is significant e.g. 29 small worsenings is not significant or 31 small worsenings are significant to determine whether a project triggers a significant air quality effect.
2.94 The change in concentration at receptors and the total number of receptors shall be used to inform whether a project has a significant air quality effect.
NOTE 1 Where the total number of receptors compiled in Table 2.92N is less than the lower guideline band for all the six magnitude of change categories, the project is unlikely to trigger a significant air quality effect for human health.
NOTE 2 A project can still be deemed significant if the number of receptors affected are below the lower guideline band, for example where there are changes in concentrations in the small magnitude of change category, but the changes are approaching the medium magnitude of change criteria (e.g. 1.8 / 1.9 ) then it can still be concluded that the project triggers a significant air quality effect.
2.95 Where the total number of receptors are greater than the upper guideline band in any of the magnitude categories the project shall trigger a significant air quality effect.
2.95.1 The competent expert for air quality should use the following criteria where the number of properties resides between the lower and upper guideline bands for any of the magnitude of change criteria in Table 2.92:
- the absolute concentration at each receptor; i.e. is the modelled concentration 40 or 60
- how many receptors are there in each of the magnitude of change criteria; that is does the project create more worsening than improvements?; and,
- the magnitude of change in concentration at each receptor, for example 0.6 vs 1.8
2.96 Where the competent expert for air quality has deemed that the project has triggered a significant air quality effect, a PAQAP shall be prepared setting out the measures that are required to mitigate the effects of the project.
Designated habitats
2.97 An assessment of the impacts on designated habitats shall be completed using the outputs from the air quality modelling.
2.98 The flow chart in Figure 2.98 shall be followed to complete the assessment of significant air quality effects on designated habitats by a competent expert for biodiversity.
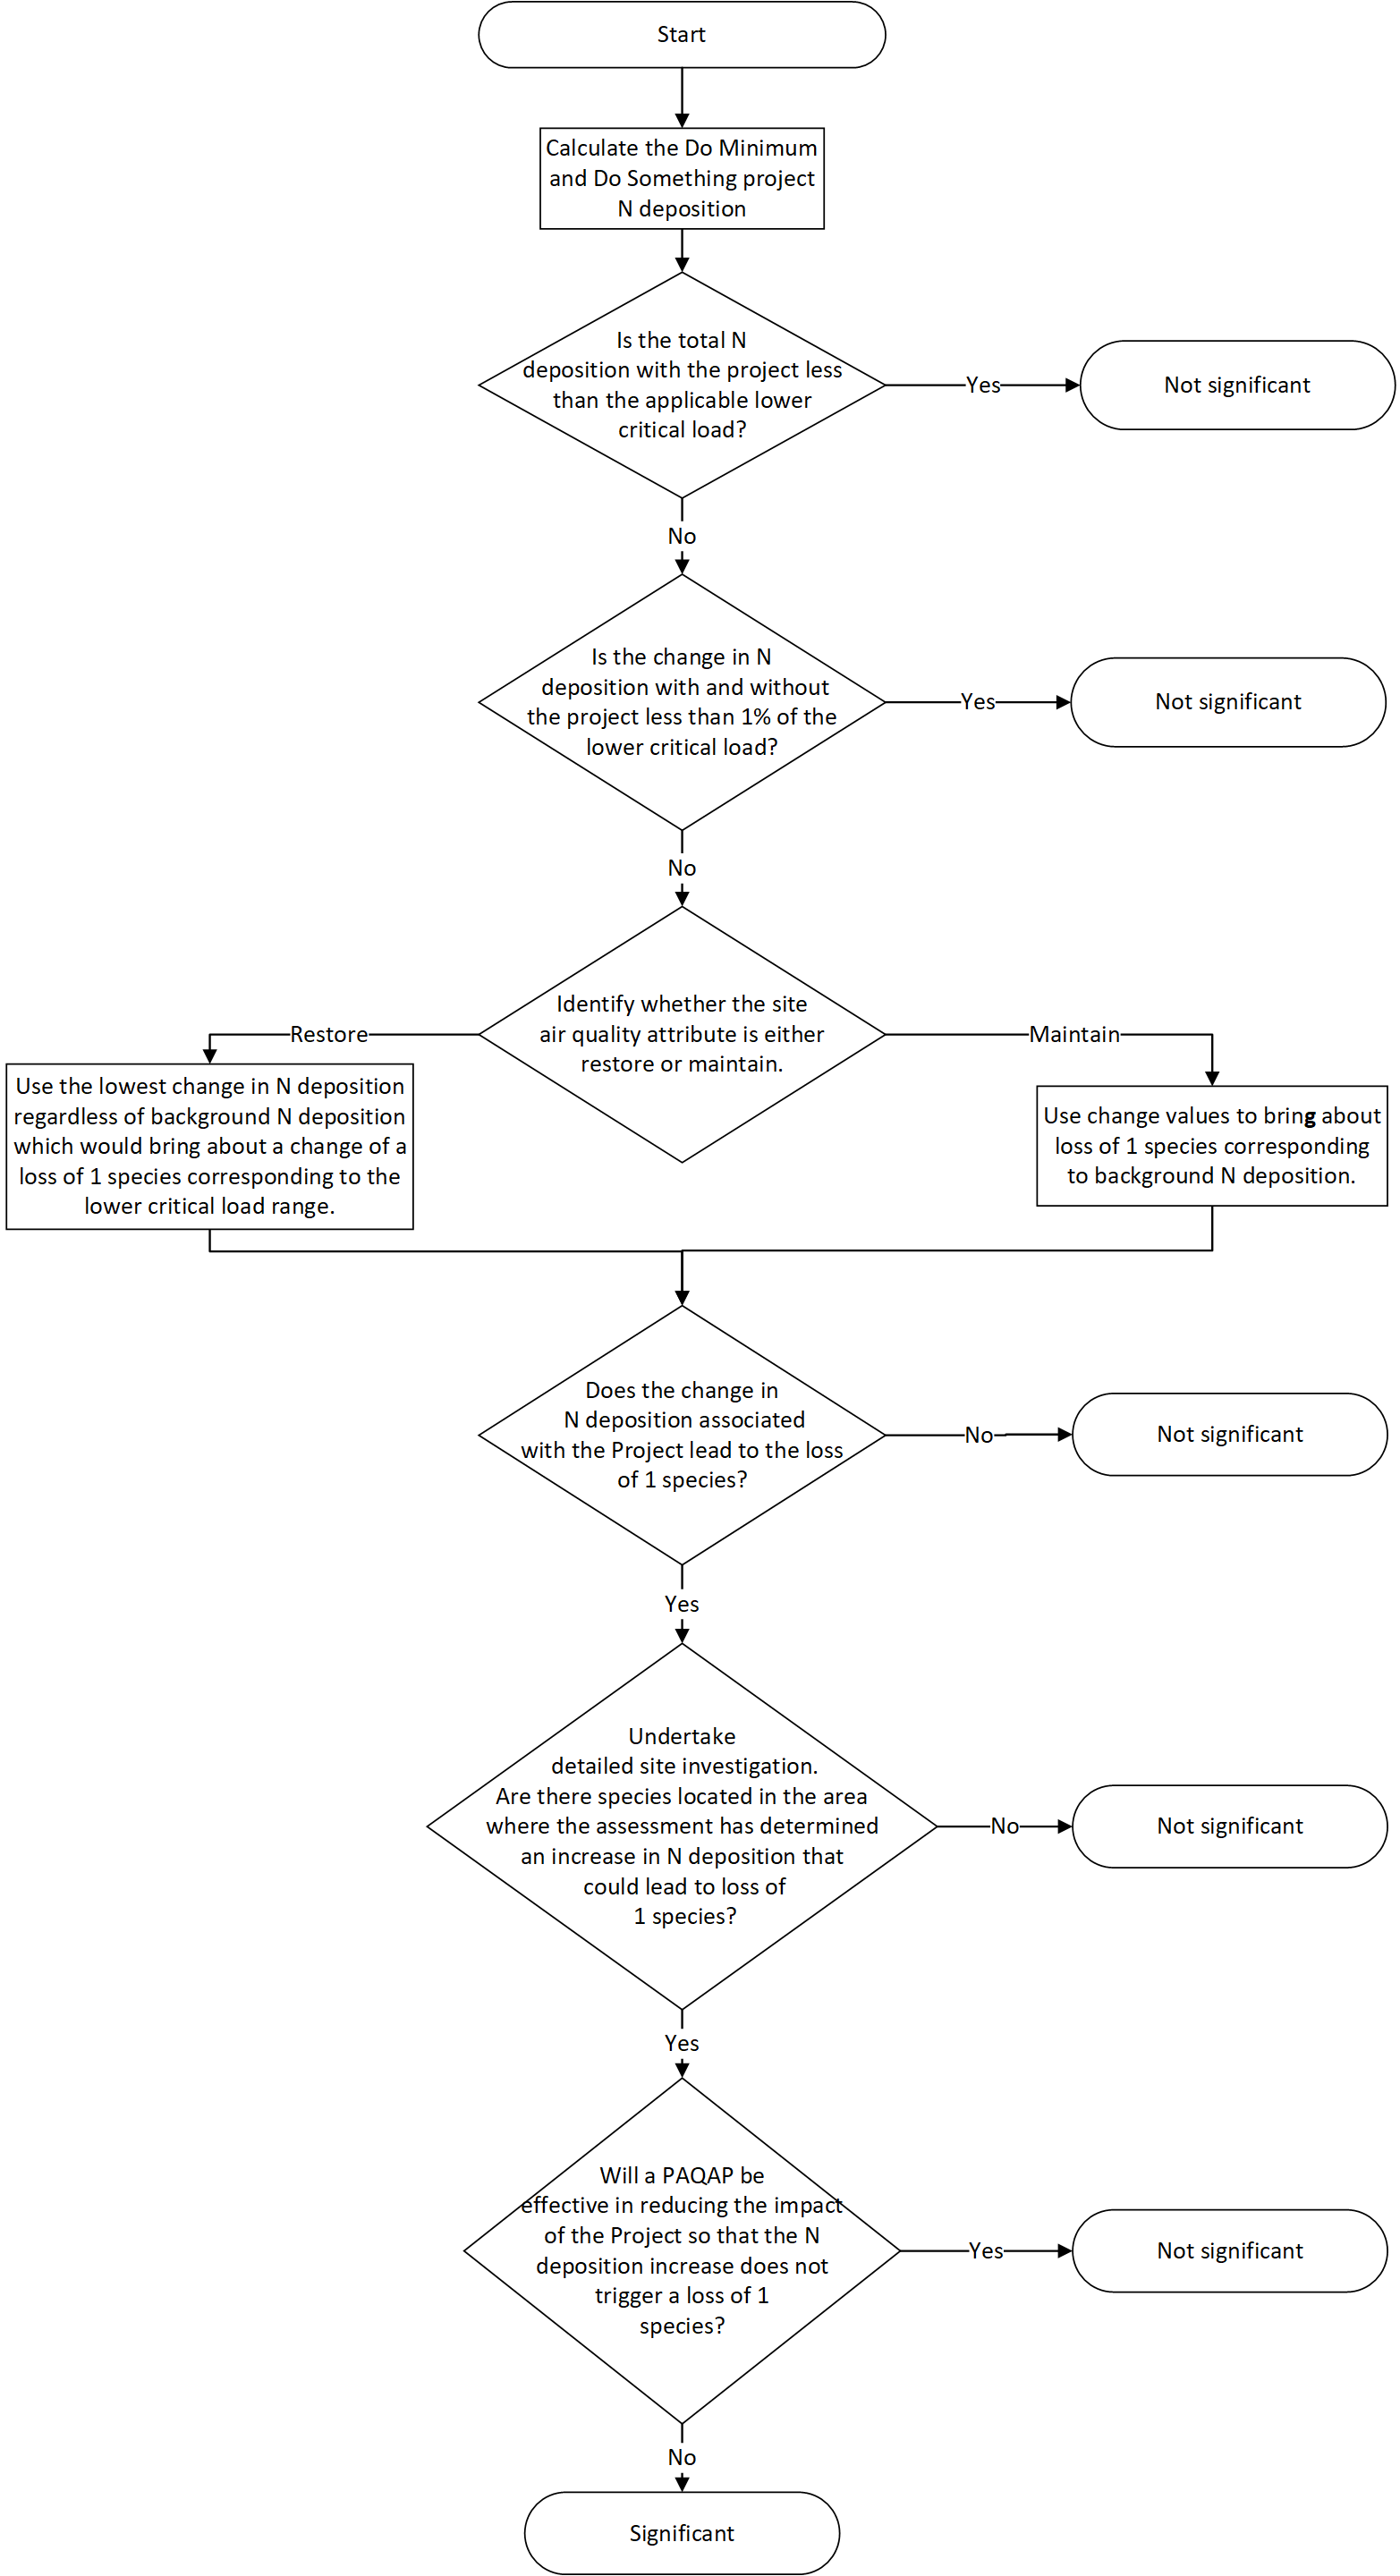
NOTE The presumption is that the air quality attribute for most designated habitats has been set to restore and the air quality assessment is completed on this basis.
2.99 If the change in N deposition is greater than 0.4kg N/ha/yr for the project, the competent expert for biodiversity shall review the air quality attribute target for the site to confirm whether it is 'restore' or 'maintain' and update the assessment if necessary.
2.100 The competent expert for biodiversity shall conclude whether the changes in nitrogen deposition are likely to trigger a significant air quality effect.
2.101 The competent expert for biodiversity shall reference Table 21 in the published nitrogen deposition dose response report by Natural England NECR210 [Ref 2.N] in their assessment of significant air quality effects.
2.102 For designated habitats not included in Natural England's report, the habitat with the lowest change in nitrogen deposition likely to lead to the loss of one species, excluding nutrient impoverished sand dunes, shall be used to inform the judgement of significant air quality effects.
Evaluating the outcomes of the significance
Operation
2.103 The competent expert for air quality shall determine whether a project triggers a significant air quality effect by assessing the following:
- the effects on human health;
- the effects on designated habitats; and,
- the outcomes of the compliance risk assessment.
2.104 The effects on human health, designated sites and the outcomes of the compliance risk assessment shall be assessed to determine whether a project triggers a significant air quality effect.
2.105 The view on significance shall be supported by a statement setting out how that judgement was arrived at, together with the supporting evidence.
Construction
2.106 The competent expert for air quality shall determine whether the effect of construction traffic from a project triggers a significant effect by assessing the following;
- effects on human health;
- effects on designated habitats; and,
- the outcome of the compliance risk assessment.
NOTE With best practice construction mitigation measures the impact of construction dust is unlikely to trigger a significant air quality effect.
Design and mitigation
Construction
2.107 Construction dust mitigation measures for the project shall be contained within the environmental management plan (EMP).
NOTE There is no requirement to provide a detailed breakdown of mitigation measures within the assessment.
2.108 The construction dust assessment shall be used to inform the best practice mitigation measures in the EMP depending on whether the project has a high or low dust risk potential.
2.108.1 Table 2.108.1 sets out the supporting activities that should be followed, based on the construction dust risk potential, to monitor the effectiveness of the proposed mitigation measures to be included in the EMP.
| High | Low |
|---|---|
|
|
NOTE In most cases monitoring for dust deposition/ambient dust would not be required given the nature of work undertaken on the majority of the construction of road projects.
Operation
2.109 Where the air quality assessment concluded that the project triggered a significant air quality effect and/or affected the UK's reported ability to comply with the 2008/50/EC [Ref 1.N] in the shortest timescales possible, a project air quality action plan (PAQAP) shall be included in the air quality assessment.
2.110 Any mitigation measures set out in the PAQAP shall:
- be viable; and,
- quantify the change in concentrations associated with the measure.
2.111 Where mitigation measures are required, the following shall be assessed for their suitability, alongside any other proposed viable mitigation measure for the project:
- a vertical barrier capable of reducing the difference between the monitored / modelled concentration for an identified section of the ARN and the required legal air quality threshold for annual mean nitrogen dioxide (40 g/m³) to be achieved in the shortest timescales possible; and,
- speed limits adjusted for air quality.
NOTE Speed limits for air quality can include reduction to 60 mph and enforcement at 70 mph.
2.112 The minimum level of change to be delivered by a vertical barrier shall be 5 g/m3 NO2 concentration at the location of the identified qualifying feature.
2.112.1 The barrier should cover the extent of the air quality exceedences plus 80 m either end of the qualifying feature.
2.112.2 Where it is not possible to extend the barrier by 80 m at either end, the designer should recommend and justify an alternative length to the Overseeing Organisation.
2.113 Where a vertical barrier is required to deliver mitigation, the proposed minimum levels of change in annual mean NO2, with the vertical barrier in place, shall to be evidenced by 'real world' air quality monitoring.
2.114 Evidence for real world air quality monitoring shall be supported by a minimum of 6 months of air quality monitoring, in line with published standards.
2.114.1 The proposed air quality monitoring should gather data from around the proposed barrier, and control locations.
2.115 The analysis of the air quality monitoring data and associated reports on the performance of the proposed measure, such as a vertical barrier, shall be undertaken by a competent expert for air quality.
NOTE Evidence based only on wind tunnel testing and/or computational fluid dynamic modelling is not an acceptable substitute for evidence of real world performance underpinned by air quality measurements.
2.116 Where a vertical barrier is required to deliver mitigation, it shall meet the requirements of:
- DMRB 'Design of minor structures' CD 354 [Ref 6.N];
- DMRB 'The design and appearance of highway structures' CD 351 [Ref 13.N]; and,
- DMRB 'Technical approval of highway structures' CG 300 [Ref 12.N].
2.117 Structural design requirements for air quality barriers shall be agreed with the Technical Approval Authority.
NOTE It is expected that air quality barriers will have similar design and certification requirements to noise barriers but with heights >3 m being Category 1.
2.118 All mitigation measures shall be capable of being in place before the annual mean NO2 threshold is predicted to be met.
2.119 The policy of the Overseeing Organisation on the purchase of properties shall be sought prior to being considered as a possible mitigation measure.
2.120 PAQAP shall be structured in the following way:
- a brief description of the project;
- a brief description of the project impacts over the study area;
- list all mitigation measures that have been considered in developing the PAQAP, and split by lead delivery authority ( i.e. Overseeing Organisation, local authority or Government) and the change in NO2 concentrations at the effected receptors; and,
- a figure illustrating the single, or combination of the identified viable mitigation measures, and the receptors they effect.
NOTE In developing the PAQAP, adopted actions contained within the Government's National Air Quality Plan JAQU Plan 2017 [Ref 3.I] or local measures within their local air quality plans and already included in the traffic model for the project, cannot be included in the PAQAP as this would be double counting.
2.121 The impacts of the project shall be re-evaluated, including the proposed mitigation measure(s), to ensure there is no longer a significant air quality effect and/or a risk to affecting the UK's reported ability to comply with the 2008/50/EC [Ref 1.N] in the shortest timescales possible.
2.122 In the event that the proposed mitigation measures are assessed not to be effective, further measures shall be investigated and assessed and the impacts of the project re-evaluated.
Assumptions and limitations
2.123 The assumptions and limitations associated with the air quality assessment for the project shall be included in the environmental assessment with a description of the potential influence on the model outcomes.
NOTE Air quality modelling like all modelling is inherently uncertain, but it is the most reliable, reasonable and robust tool available to determine whether a project has a significant air quality effect and/or affects the UK's reported ability to comply with the 2008/50/EC [Ref 1.N] in the shortest timescales possible.
2.124 To help manage uncertainty in air quality modelling, the modelled concentrations in the base year shall be verified against air quality monitoring data in accordance with Defra guidance TG 16 [Ref 8.N].
2.125 The verification adjustment factors shall be applied to the modelled concentrations in the base year and do minimum and do something scenarios in the opening year.
2.126 Uncertainty in future air quality is one of the key assumptions in air quality modelling and the approach for addressing uncertainty in predicted future roadside NOx and NO2 trends shall be followed.
3. Reporting
3.1 The air quality assessment shall contain the information presented in Table 3.1.
| Section | Required information |
|---|---|
| Scoping |
|
| Baseline |
|
| Policy |
|
| Methodology |
|
| Assessment of air quality impacts |
|
| Assessment of construction impacts |
|
| Compliance with policy |
|
| Mitigation |
|
| Figures |
|
4. Monitoring of mitigation measure(s)
4.1 Where a project has included mitigation measure(s), air quality monitoring shall be implemented to demonstrate when and if the mitigation measure(s) can be removed (assuming the mitigation is time-limited and not permanent).
4.2 Where monitoring is required, the competent expert for air quality shall consult the Overseeing Organisation to agree the locations, the type of monitoring to be deployed and the likely duration.
4.2.1 The monitoring should be representative of the area where the assessment predicts the significant air quality effect and/or affected the UK's reported ability to comply with the 2008/50/EC [Ref 1.N] in the shortest timescales possible.
4.3 A map showing the locations shall be produced.
4.4 Air quality monitoring shall not be required for projects that do not require mitigation.
5. Normative references
The following documents, in whole or in part, are normative references for this document and are indispensable for its application. For dated references, only the edition cited applies. For undated references, the latest edition of the referenced document (including any amendments) applies.
| Ref. | Document |
|---|---|
| Ref 1.N | Europa.eu. 2008/50/EC, 'Ambient air quality and cleaner air for Europe' |
| Ref 2.N | Natural England . NECR210, 'Assessing the effects of small increments of atmospheric nitrogen deposition (above the critical load) on semi-natural habitats of conservation importance.' |
| Ref 3.N | Europa.eu. 2014/52/EU, 'Assessment of the effects of certain public and private projects on the environment' |
| Ref 4.N | National Highways. LA 108, 'Biodiversity' |
| Ref 5.N | National Highways. LA 114, 'Climate' |
| Ref 6.N | National Highways. CD 354, 'Design of minor structures' |
| Ref 7.N | National Highways. GG 101, 'Introduction to the Design Manual for Roads and Bridges' |
| Ref 8.N | Defra. TG 16, 'Local Air Quality Management Technical Guidance (TG16) February 2018' |
| Ref 9.N | LAQM, 'Local air quality management tool. https://laqm.defra.gov.uk/review-and-assessment/tools/background-maps.html ' |
| Ref 10.N | Defra. Modelled air quality data, 'Modelled air quality data' |
| Ref 11.N | National Highways. LA 112, 'Population and human health' |
| Ref 12.N | National Highways. CG 300, 'Technical approval of highway structures' |
| Ref 13.N | National Highways. CD 351, 'The design and appearance of highway structures' |
6. Informative references
The following documents are informative references for this document and provide supporting information.
| Ref. | Document |
|---|---|
| Ref 1.I | www.apis.ac.uk. APIS (website), 'Air Pollution Information System (APIS) ' |
| Ref 2.I | AQTAG06, 'Technical guidance on detailed modelling approach for an appropriate assessment for emissions to air' |
| Ref 3.I | Defra and DfT. Joint Air Quality Unit. JAQU Plan, 'UK plan for tackling roadside nitrogen dioxide concentrations ' , 2017 |
Appendix A. Speed pivoting methodology
A1 Speed banding of traffic modelled speeds for use with air quality assessments
A1.1 Background
The competent expert from the traffic team provides the competent expert for air quality with the speed bands required to generate the vehicle emission factors for the corresponding speed band .
Speed banding ensures that speeds from the traffic model are used to reflect different states of driving conditions with an assigned emission factor.
The speed band descriptors for motorway and urban roads are presented in Tables A.1 and A.2.
| Category | Speed range (kph) | General description |
|---|---|---|
| Heavy congestion | 5 – 48 | Traffic with a high degree of congestion and stop-start driving behaviour, junction mergers, slip roads with queuing traffic. |
| Light congestion | 48 – 80 | Traffic with some degree of flow breakdown, typical volume/capacity (v/c) >80%. Normal operation on slip roads. |
| Free flow | 80 – 96 | Motorway generally free-flow driving conditions with little or no flow breakdown. Motorway busy but not congested, v/c <80%. |
| High speed | 96 - 140 | Motorway unconstrained, typical of overnight conditions when traffic light. |
| Category | Speed range (kph) | General description |
|---|---|---|
| Heavy congestion | 5 – 20 | Traffic with a high degree of congestion. Within a 100-m radius of road junction with a high degree of congestion. |
| Light congestion | 20 – 45 | Typical urban traffic with a reasonable degree of congestion. Within a 100-m radius of road junction. |
| Free flow | 45 – 80 | Typical urban traffic with limited or no congestion. |
| High speed | 80 - 112 | High speed urban single or dual carriageway. |
The speed pivoting methodology is only to be applied to road links included in the traffic reliability area (TRA) and for only those road links used in the air quality assessment.
A proportionate approach to the speed pivoting process is required, e.g. if there is no possibility of exceedances of air quality thresholds, or the air quality assessment is at options stage for the project using AADT traffic data, then speed pivoting is not required.
For early stages of project development it is not necessary to undertake the full speed pivoting process, particularly where the traffic models are likely to be updated. The amount of detail required for the speed banding is proportionate to the stage of the assessment.
Where significant risks to air quality have been identified during the early stages of a project, which could risk a delay to project delivery, it is necessary to undertake selective speed pivoting in the area of concern.
A1.2 Speed pivoting process
Observed vehicle speeds at a link level will need to be obtained for the traffic model base year from data sets such as TrafficMaster, GPS, mobile phone data, etc.
The observed traffic speeds along the road links provided for use in the air quality assessment need to be obtained for the base year and averaged over the period corresponding to the same period in the air quality model.
For a detailed air quality assessment, the air quality model is generally broken down into four periods to represent the change in emissions over the day (AM, IP, PM and OP). The AM period, for example, generally represents a 3-hour period 07:00 until 10:00.
The traffic model network and the network used for the observed speeds are likely to be different, as a result, the data needs to be processed so that the observed speeds are comparable geographically with the traffic-modelled road links.
The factor generated between the comparison of the base year modelled speed and the observed speed, known as the speed pivot factor (SP) (i.e. SP = speed observed in base year/speed modelled in base year), will need to be calculated and used to adjust the individual base year and forecast year link speeds output from the traffic model.
It is recognised that observed speed data is not always available for every road link in the traffic model and consequently an ‘infilling’ process will be required to pivot the modelled traffic speeds on these road links.
For those road links and/or times of day when observed speeds are not available infilling needs to be undertaken whereby an SP on roads representative of the link with no observed speeds is used.
The infilling process can be informed by considering, for example, the speed pivoting performance on adjacent links, the speed pivoting performance on roads with similar characteristics either in the local area or globally across the TRA if available, e.g. motorways, urban centre roads, single carriageways, and rural roads.
Where there is no observed speed, i.e. the link is a new road (e.g. bypass) the modelled speed needs to be used to generate the speed band.
Where the speed pivot factors are high then it may not be appropriate to apply these to the forecast speeds as any change (between assessment scenarios) would be magnified and/or the result in speeds being greater than the speed limit of the road.
In these circumstances a judgement should be made by the competent expert for traffic to determine whether the traffic conditions are likely to have changed because of the project from the base year.
If the competent expert for traffic deems the traffic conditions observed for the base year are not likely to significantly change in the forecasts years, then the base year speed band needs to be used and the reasoning behind the judgement recorded.
The speed bands are to be plotted in GIS to check the speed bands spatially in the forecast years to identify any anomalies in the generated speed bands. This will be useful for example to determine whether there are changes in speed bands along the same section of motorway which may be because of very small changes in speed.
Where speed bands have changed between the do minimum and do something scenarios, the bands need to be checked to ensure that the change in band can be justified because of the project.
This analysis however needs to focus on areas identified as sensitive to changes in air quality that may result in exceedances of air quality thresholds to ensure it is proportionate.
Very small changes in speed between modelled scenarios will not always necessitate a change in speed band. It is important that the speed banding process is not just a numerical process whereby the speed ranges are put into the respective bands with no sense-checking of the bands that the links have been allocated to.
The receptor concentrations modelled in the base year by the competent air quality expert will provide an indication of the areas that are sensitive to change and hence require greater analysis in relation to changes in speed bands as a result of the project.


