Skip to content

Design Manual for Roads and Bridges


Pavement

Inspection & Assessment

CS 230 Pavement maintenance assessment procedure

(formerly HD 29/08, HD 30/08)

Version 0.1.0

Summary

This document sets out the requirements for reviewing routine/network level data in order to establish whether there is a pavement maintenance need that requires further investigation. The review will identify lengths of pavement, some of which will be selected for detailed investigation. This document is complemented by CD 227 which sets out the requirements for determining the need for maintenance and for designing maintenance treatments, and by CS 229 which sets out the requirements for undertaking detailed pavement investigations. Requirements for assessing skidding resistance on the network are set out in CS 228.

National Variation

This document has associated National Application Annexes providing alternative or supplementary content to that given in the core document, which is relevant to specific Overseeing Organisations. National Application Annexes are adjoined at the end of this document.

Feedback and Enquiries

Users of this document are encouraged to raise any enquiries and/or provide feedback on the content and usage of this document to the dedicated National Highways team. The online feedback form for all enquiries and feedback can be accessed at: www.standardsforhighways.co.uk/feedback.

This is a controlled document.

Latest release notes

Document Code Version number Date of publication of relevant change Changes made to Type of change
CS 230 0.1.0 December 2022 Core document, England NAA Incremental change to requirements
[PUB. Dec. 2022] Contains updated requirements covering legacy concrete pavements.

Previous versions

Document Code Version number Date of publication of relevant change Changes made to Type of change
CS 230 0 March 2020

Foreword

Publishing information

This document is published by National Highways.

Together with CS 229 [Ref 1.I] and CD 227 [Ref 1.N], this document supersedes HD 29/08 and HD 30/08, which are withdrawn.

Contractual and legal considerations

This document forms part of the works specification. It does not purport to include all the necessary provisions of a contract. Users are responsible for applying all appropriate documents applicable to their contract.

Introduction

Background

Road pavements do not last indefinitely. At some stage in their lives signs of wear such as polishing, rutting, fretting and cracking may show on the surface. Maintenance is required when these signs of wear are judged to affect the standards of service provided to the road user and the integrity of the pavement structure.

The Overseeing Organisations use a hierarchical approach to assess the needs of the carriageways on motorways and all-purpose trunk roads:

1) Network-level surveys, undertaken on a routine basis, are used to identify lengths of pavement that potentially require maintenance. Wherever possible these surveys are undertaken at traffic speed. The requirements for this process are set out in this document. Requirements to be used to determine and assess skidding resistance on the network are set out in CS 228 [Ref 2.I].

2) Once a length has been identified as requiring maintenance then a detailed investigation is required to determine the maintenance need and to provide the information required to design the appropriate maintenance treatments. The requirements for this process are set out in CD 227 [Ref 1.N].

3) The technical requirements and associated advice for collecting the scheme-level data required to support this process are set out in CS 229 [Ref 1.I].

Assumptions made in the preparation of this document

The assumptions made in GG 101 [Ref 2.N] apply to this document.

Mutual recognition

Where there is a requirement in this document for compliance with any part of a "British Standard" or other technical specification, that requirement may be met by compliance with the Mutual Recognition clause in GG 101 [Ref 2.N]Introduction to the Design Manual for Roads and Bridges (as the standard text in MDD v6 cl 4.39).

1. Scope

Aspects covered

1.1 The requirements in this document shall be used to identify lengths of pavement on the carriageways of the Overseeing Organisations’ motorway and all-purpose trunk road network that require maintenance.

NOTE 1 The requirements for undertaking detailed investigations for determining maintenance need and providing the information required to design the appropriate maintenance treatments are set out in CD 227 [Ref 1.N].

NOTE 2 The technical requirements and associated advice for collecting the scheme-level data required to support the design process are set out in CS 229 [Ref 1.I].

NOTE 3 This document does not cover skid resistance. Requirements for determining and assessing skidding resistance on the network are set out in CS 228 [Ref 2.I].

Implementation

1.2 This document shall be implemented forthwith on all schemes involving the design of pavement renewals on the Overseeing Organisations’ motorway and all-purpose trunk roads according to the implementation requirements of  GG 101 [Ref 2.N].

Use of GG 101

1.3 The requirements contained in GG 101 [Ref 2.N] shall be followed in respect of activities covered by this document.

2. Network level surveys

2.1 This section sets out details of the network level pavement condition surveys that shall be undertaken and used to identify lengths of pavement that require maintenance.

NOTE 1 Network level surveys are carried out on a routine basis on the Overseeing Organisations’ motorway and all-purpose trunk roads. Wherever possible these surveys are undertaken at traffic speed.

NOTE 2 Network level surveys can be categorised as surface condition or structural condition.

Surface condition surveys

2.2 Surface condition surveys shall be undertaken on the Overseeing Organisations’ motorway and all-purpose trunk roads in accordance with the National Application Annex (NAA).

NOTE 1 Surface condition surveys are undertaken at traffic speed using survey vehicles equipped with sophisticated measurement apparatus.

NOTE 2 Typically surface condition surveys provide data on rutting (transverse profile), ride quality (longitudinal profile), texture depth and road geometry (gradient, crossfall and curvature). They can include collection of forward and downward facing images.

NOTE 3 Some of the data collected by surface condition surveys can be used to provide information on the structural condition of the pavement.

NOTE 4 Skidding resistance is a property of surface condition. This document does not cover skidding resistance. Requirements for determining and assessing skidding resistance on the network are set out in CS 228 [Ref 2.I].

Structural condition surveys

2.3 Structural condition surveys shall be undertaken on the Overseeing Organisations’ motorway and all-purpose trunk roads in accordance with the NAA.

NOTE Typically structural condition surveys provide data on the deflection response of the pavement. This data is used to assess the structural strength of the pavement.

3. Other sources of relevant data

3.1 To supplement the data collected from network-level condition surveys, data from other sources shall be used to assist with the identification of lengths of pavement that potentially require maintenance.

3.1.1 Data from the following sources should be used:

  1. safety inspections;
  2. other routine inspections that are regularly undertaken to identify the presence of pavement defects;
  3. records of unplanned and/or reactive maintenance.

NOTE Data from the previous three years are typically used to identify lengths of road that are regularly and/or repeatedly requiring maintenance.

3.1.2 Information from other records and sources of data may be used to assist with the identification of lengths of pavement that require maintenance.

4. Review of data

4.1 The network level survey data (described in Section 2) and the additional data (described in Section 3) shall be collated and reviewed in accordance with the requirements of the NAA in order to identify lengths of pavement for potential maintenance treatment.

NOTE 1 The review involves comparing the outputs from the network level data against threshold levels of condition for different parameters. Lengths where one or more of the parameters exceed the threshold values can indicate the need for further investigation.

NOTE 2 Records of inspections, unplanned maintenance and reactive maintenance from the past three years are typically used to identify additional lengths. These records can also provide supplementary evidence for lengths already identified by the network level surveys.

4.2 Lengths of pavement identified for potential maintenance treatment shall be subject to a visual assessment, either a drive-over or a review of video images, before finalising the list of lengths to be investigated.

NOTE The visual assessment information can provide supporting evidence of the current condition.

4.3 Lengths of pavement identified for potential maintenance treatment shall be selected for further investigation.

4.4 The reasons why lengths have been selected for further investigation shall be documented and retained.

NOTE The list of lengths can be reviewed by the Overseeing Organisation.

4.5 Where further investigations are proposed, these shall be undertaken in accordance with CD 227 [Ref 1.N].

5. Normative references

The following documents, in whole or in part, are normative references for this document and are indispensable for its application. For dated references, only the edition cited applies. For undated references, the latest edition of the referenced document (including any amendments) applies.

Ref. Document
Ref 1.N National Highways. CD 227, 'Design for pavement maintenance'
Ref 2.N National Highways. GG 101, 'Introduction to the Design Manual for Roads and Bridges'

6. Informative references

The following documents are informative references for this document and provide supporting information.

Ref. Document
Ref 1.I National Highways. CS 229, 'Data for pavement assessment'
Ref 2.I National Highways. CS 228, 'Skidding resistance'
Skip to content

Design Manual for Roads and Bridges

Pavement

Inspection & Assessment

CS 230 - ENAA England National Application Annex for Pavement maintenance assessment procedure

(formerly HD 29/08, HD 30/08 (parts))

Version 0.1.0

Summary

This National Application Annex contains the National Highways-specific requirements for routine, network-level surveys of pavement surface condition and structural condition.

Feedback and Enquiries

Users of this document are encouraged to raise any enquiries and/or provide feedback on the content and usage of this document to the dedicated National Highways team. The online feedback form for all enquiries and feedback can be accessed at: www.standardsforhighways.co.uk/feedback.

This is a controlled document.

Latest release notes

Document Code Version number Date of publication of relevant change Changes made to Type of change
CS 230 - ENAA 0.1.0 December 2022 England NAA Incremental change to requirements
[PUB. Dec. 2022] Contains updated requirements covering legacy concrete pavements.

Previous versions

Document Code Version number Date of publication of relevant change Changes made to Type of change
CS 230 0 March 2020

Foreword

Publishing information

This document is published by National Highways.

Together with CS 229 [Ref 1.N] and CD 227 [Ref 3.N], this document supersedes HD 29/08 and HD 30/08, which are withdrawn.

This revision includes additional requirements for the maintenance of legacy concrete pavements aligned with National Highways concrete roads programme.

Contractual and legal considerations

This document forms part of the works specification. It does not purport to include all the necessary provisions of a contract. Users are responsible for applying all appropriate documents applicable to their contract.

Introduction

Background

This National Application Annex gives the National Highways-specific requirements for routine, network-level surveys of pavement surface condition and structural condition. It sets out the requirements for reviewing the outputs from these surveys in order to identify lengths of carriageway that are potentially in need of maintenance and that require a detailed assessment. It does not cover the routine measurement of skidding resistance which is dealt with in CS 228 [Ref 2.I].

This document also sets out the requirements for identifying technically simple pavement schemes (TSS) and lengths that may be suitable for a preventative maintenance treatment using an asphalt preservation system. Technically simple pavement schemes are lengths of carriageway where there are no structural problems i.e. where deterioration is confined to the surface course. These schemes can require renewal of only the surface course and are subject to a simplified development and assessment process. Lengths identified as being suitable for a preventative maintenance treatment using network data are subject to further laboratory investigation as set out in CD 227 [Ref 3.N].

This revision includes additional requirements covering the network level assessment of legacy concrete pavements.

Assumptions made in the preparation of this document

The assumptions made in GG 101 [Ref 4.N] apply to this document.

Mutual recognition

Where there is a requirement in this document for compliance with any part of a "British Standard" or other technical specification, that requirement may be met by compliance with the mutual recognition clause in GG 101 [Ref 4.N].

Abbreviations

Abbreviations
Abbreviations Definition
BITS Bituminous (base type)
BCD Base condition data
CBT Characteristic base type
CEMT Cementitious (base type)
CRCP Continuously reinforced concrete pavement
CSC Characteristic skid coefficient
eLPV Enhanced longitudinal profile variance
GNCA Granular with no cementing action (base type)
HAPMS National Highways' pavement management system
HAST HAPMS support team
HBM Hydraulically bound mixture
HFS High friction surfacing
HRA Hot rolled asphalt
LEW Lifecycle extension works
LPV Longitudinal profile variance
LW Length weighted
LWAVG Length weighted average
LRP Location reference point
MSP Machine survey pre-processor
NSC Network structural condition
RCD Raw condition data
SMTD Sensor measured texture depth
TRACS TRAffic-speed condition survey
TRACS4 TRAffic-speed condition survey contract 4
TRASS TRAffic-speed structural condition surveys
TRASS3 TRAffic-speed structural condition surveys contract 3
TSCS Thin surface course system
TSD National Highways' traffic speed deflectometer
TSS Technically simple pavement scheme

Terms and definitions

Terms
Term Definition
Legacy concrete pavement A rigid pavement with a concrete surface, or up to 50 mm of asphalt surfacing, constructed as:
  1. a jointed reinforced concrete pavement (JRC);
  2. a jointed unreinforced concrete pavement (URC); or
  3. a continuously reinforced concrete pavement (CRCP) (not designed in accordance with CD 226 [Ref 2.N]).

E/1. Network level surveys

Surface condition surveys (CS 230, 2.2)

TRACS contract and parameters

E/1.1 Network level surface condition surveys on the National Highways motorway and all-purpose trunk road network shall be undertaken as part of the TRACS4 contract, centrally managed by National Highways.

NOTE 1 TRACS stands for TRAffic-speed condition survey.

NOTE 2 The coverage and frequency of surveys are set out in the TRACS4 contract. TRACS surveys cover all mainline running lanes and lane 1 of slip roads. Roundabouts are not included.

E/1.2 The TRACS vehicles shall be accredited by National Highways for use on their network.

E/1.3 TRACS surveys shall be controlled by a detailed quality audit procedure for the surveys, which includes regular independent checks to maintain quality assurance.

E/1.4 TRACS surveys shall provide the following information about the pavement:

  1. geometry (gradient, crossfall, radius);
  2. rutting;
  3. 3-m, 10-m and 30-m enhanced longitudinal profile variance (eLPV);
  4. bump measure;
  5. sensor measured texture depth (SMTD);
  6. lane fretting intensity (reported on asphalt surfaces only);
  7. noise;
  8. surface type; and,
  9. cracking (reported on asphalt surfaces only).

NOTE 1 TRACS data is available in HAPMS and is referenced to the HAPMS network.

NOTE 2 The road geometry measures are used in the classification of site categories for assigning investigatory levels of skidding resistance. See CS 228 [Ref 2.I]

NOTE 3 The TRACS cracking measure was introduced in 2018 and there are currently no guidance levels for interpretation of this parameter.

NOTE 4 TRACS also measures retroreflectivity of road markings. Inspection and maintenance of road markings is covered in CS 126 [Ref 1.I].

NOTE 5 TRACS also collects high quality downward and forward facing images. These images provide information that can be used for detailed visual condition surveys of the carriageway as described in CS 229 [Ref 1.N] and for the network visual assessment of rigid pavements, as described in this document.

NOTE 6 For legacy concrete pavements, condition is assessed centrally by National Highways using condition data derived from a modified analysis of TRACS data.

NOTE 7 Detailed guidance on the TRACS parameters is provided in the TRACS guidance documents available to National Highways staff and authorised service providers.

NOTE 8 Further information is available from the National Highways HAPMS support team (HAST).

TRACS texture depth, rut depth and eLPV

TRACS condition categories

E/1.5 TRACS texture depth, rut depth and enhanced longitudinal profile variance (eLPV) data shall be assessed against the four condition categories defined in Table E/1.5.

Table E/1.5 Condition categories for TRACS texture depth, rut depth and eLPV
Condition category Definition
1 Sound – negligible deterioration.
2 Some deterioration – low level of concern.
3 Moderate deterioration – warning level of concern.
4 Severe deterioration – intervention level of concern.

Rut depth

E/1.6 The TRACS rut depth levels that shall be used to define condition category are given in Table E/1.6.

Table E/1.6 Condition categories for TRACS rutting measurements (100m lengths)
Condition category Maximum rut (mm)
1 <6
2 6≤ [rut] <11
3 11≤ [rut] <20
4 ≥20

NOTE 1 The categories apply to the 100-m TRACS length weighted (LW) average maximum rut measurement as reported by HAPMS.

NOTE 2 Rutting is reported on all surface types.

Texture depth

E/1.7 The TRACS texture depth levels that shall be used to define condition category are given in Table E/1.7.

Table E/1.7 Condition categories for TRACS texture depth measurements (100-m lengths)
Category Texture depth (mm)
High friction
surfacing (HFS)
All other surfaces
1 >0.6 >1.1
2 ≤0.6 0.8< [SMTD] ≤1.1
3 N/A 0.4 < [SMTD] ≤0.8
4 N/A ≤0.4

NOTE 1 The categories apply to the 100-m TRACS length weighted (LW) average texture depths as reported by HAPMS.

NOTE 2 Texture is reported on all surface types.

NOTE 3 Changes in texture depth can indicate a potential loss of skid resistance. Advice on the interpretation of texture depth data in connection with skid resistance is given in CS 228 [Ref 2.I].

NOTE 4 Lower texture depth values are applied to HFS due to the different way in which skid resistance is provided by these materials.

NOTE 5 The texture depth of HFS can only be in condition category 1 or 2.

Enhanced longitudinal profile variance (eLPV)

E/1.8 The TRACS eLPV levels that shall be used to define condition category are given in Tables E/1.8a to E/1.8c.

Table E/1.8a Condition categories for eLPV on motorways and rural dual carriageways (100-m lengths)
Category Enhanced longitudinal profile variance (mm2)
3 m 10 m 30 m
1 <0.7 <1.6 <22
2 0.7≤ [eLPV] <2.2 1.6 ≤ [eLPV] <6.5 22≤ [eLPV] <66
3 2.2≤ [eLPV] <4.4 6.5 ≤ [eLPV] <14.7 66 ≤ [eLPV] <110
4 ≥4.4 ≥14.7 ≥110
Table E/1.8b Condition categories for eLPV on urban dual carriageways and rural single carriageway roads (100-m lengths)
Category Enhanced longitudinal profile variance (mm2)
3 m 10 m 30 m
1 <0.8 <2.8 <30
2 0.8≤ [eLPV] <2.2 2.8 ≤ [eLPV] <8.6 30 ≤ [eLPV] <75
3 2.2≤ [eLPV] <5.5 8.6 ≤ [eLPV] <22.8 75 ≤ [eLPV] <121
4 ≥5.5 ≥22.8 ≥121
Table E/1.8c Condition categories for eLPV on urban single carriageway roads (100-m lengths)
Category Enhanced longitudinal profile variance (mm2)
3 m 10 m 30 m
1 <1.4 <6.1 <48
2 1.4 ≤ [eLPV] <3.8 6.1 ≤ [eLPV] <18.3 48 ≤ [eLPV] <97
3 3.8 ≤ [eLPV] <9.3 18.3 ≤ [eLPV] <36.6 97 ≤ [eLPV] <193
4 ≥9.3 ≥36.6 ≥193

NOTE 1 The categories apply to the 100-m TRACS length weighted (LW) average maximum eLPV values as reported by HAPMS.

NOTE 2 The three eLPV measures reported in HAPMS indicate the level of profile unevenness within wavelength ranges less than or equal to 3 m, 10 m and 30 m. These values are broadly correlated to levels of ride comfort (ride quality).

NOTE 3 The eLPV values are set to reflect the standard of ride quality required on different types of road. For example, motorways require a better standard of ride quality than urban single carriageways.

NOTE 4 The road classifications are based on the road classifications in HAPMS.

TRACS lane fretting intensity

E/1.9 TRACS lane fretting Intensity shall be assessed against the guidance values shown in Table E/1.9.

Table E/1.9 Guidance values for TRACS lane fretting intensity (100-m lengths)
Description Lane fretting intensity
Very low or no fretting <2
Likely to be low fretting over long lengths
or
moderate fretting over a short length
2≤ [lane fretting] <10
Likely to be moderate fretting over long lengths
or
severe fretting over a short length
10≤ [lane fretting] <20
Likely to be severe patches of fretting ≥20

NOTE 1 The categories apply to the 100-m TRACS length weighted (LW) average lane fretting intensity values as reported by HAPMS.

NOTE 2 TRACS lane fretting intensity applies to all asphalt surfaces.

NOTE 3 TRACS lane fretting intensity is reported within the range 0 to 625.

TRACS bump measure

E/1.10 The TRACS bump measure shall be used to identify lengths containing short defects ("bumps") that are not effectively identified from eLPV.

NOTE 1 The parameter is reported from HAPMS as 100-m TRACS length weighted average bump measure.

NOTE 2 "Bumps" can cause jolt-like sensations within vehicles. Examples of "bumps" include sunken ironwork, potholes and poor transverse joints.

NOTE 3 The bump measure is reported as either 0 or 1.1 indicates that the length contains one or more "bumps".

TRACS surface type and noise

E/1.11 TRACS surface type and noise shall be used to provide additional information about lengths of pavement that have been identified as potentially being in need of maintenance.

E/1.11.1 The TRACS surface type may be used to cross check the accuracy of the surface construction records in HAPMS.

NOTE The TRACS surface type provides a prediction of the surface type based on texture data and luminosity of the surface.

E/1.11.2 The TRACS noise measure may be used to aid the investigation of noise levels.

NOTE The TRACS noise measure provides a prediction of the noise levels generated by the surface/tyre interaction based on texture and the TRACS surface type.

Assessment of legacy concrete pavements

E/1.12 The condition of legacy concrete pavements shall be assessed using condition data that is derived from a modified analysis of TRACS data.

E/1.13 Legacy concrete pavements shall be assigned a state as defined in table E/1.13.

Table E/1.13 State of legacy concrete pavements
State Description
Stable Pavement in good or generally good condition. Some localised intervention may be required.
Transitional Widespread intervention required. Pavement condition is deteriorating.
Targeted Pavement that will fail at random times and by random mechanisms. Intervention other than reconstruction cannot restore the pavement to a stable or transitional state.

TRACS network assessment of CRCPs

E/1.14 TRACS downward facing images shall be reviewed and used to carry out a network visual condition assessment of each running lane of CRCPs designed in accordance with CD 226 [Ref 2.N].

NOTE The assessment is based on the number of significant defects per 100-m length in each lane (see CS 229 [Ref 1.N] for the definition of significant defects).

E/1.15 A procedure shall be put in place for reviewing all lengths of CRCP at least once every three years.

E/1.15.1 The review may be done by reviewing one third of the length each year or all lengths of CRCP every three years.

E/1.16 The level of visual defects that shall be used to define condition category are given in Table E/1.16.

Table E/1.16 Network visual assessment categories for CRCPs (100-m lengths)
Visual condition category Description Number of significant defects per 100-m length
1 Low level of deterioration 0< [defects] ≤5
2 Moderate level of deterioration 5< [defects] ≤10
3 High level of deterioration 10< [defects] ≤15
4 Severe level of deterioration – intervention
level of concern
>15

Structural condition surveys (CS 230, 2.3)

TRASS contract and parameters

E/1.17 Network level structural condition surveys on the National Highways motorway and all-purpose trunk road network shall be undertaken as part of the TRASS3 contract, centrally managed by National Highways.

NOTE 1 TRASS stands for TRAffic-speed Structural condition Surveys (TRASS).

NOTE 2 TRASS survey data is only valid for flexible pavements i.e. flexible with an asphalt base and flexible with an HBM base.

NOTE 3 The coverage and frequency of surveys are set out in the TRASS3 contract. TRASS surveys cover lane 1 and lane 2 of mainline and lane 1 of slip roads. Roundabouts are not included.

E/1.18 National Highways' traffic speed deflectometer (TSD) shall be used to carry out the TRASS surveys.

E/1.19 The TSD shall be accredited by National Highways for use on their network.

E/1.20 The TSD surveys shall be controlled by a detailed quality audit procedure for the surveys, which includes regular independent checks to maintain quality assurance.

E/1.21 TRASS surveys shall be used to provide information about the structural condition of flexible pavements.

NOTE TRASS data is available in HAPMS and is referenced to the HAPMS network.

E/1.22 The latest construction and traffic information shall be used when reviewing TRASS data for assessment purposes.

NOTE The robustness of the reported TRASS analysis results are critically dependent on the availability of accurate construction and traffic data in HAPMS.

Condition categories

E/1.23 The results from TRASS shall be assessed against the four network structural condition (NSC) categories defined in Table E/1.22.

Table E/1.23 TRASS network structural condition (NSC) categories
NSC category Description
1 Flexible pavements without any need for structural maintenance
2 Flexible pavements unlikely to need structural maintenance
3 Flexible pavements likely to need structural maintenance
4 Flexible pavements very likely to need structural maintenance
Null Unable to complete valid analysis of TRASS data

NOTE 1 The categories apply to the 100-m TRASS NSC as reported by HAPMS.

NOTE 2 NSC is reported as “null” when it is not possible to complete the analysis procedure satisfactorily; for example where pavement quality concrete is present or where construction and/or traffic data are not available.

NOTE 3 Further information on the use of TRASS NSC categories for determining the need for deflectograph surveys as part of a renewal pavement investigation is given in CD 227 [Ref 3.N].

NOTE 4 Further information on TRASS and the TSD is given in Appendix E/B.

E/2. Review of data (CS 230, 4.1)

Legacy concrete pavements

E/2.1 For legacy concrete pavements, condition data shall be reviewed in order to select lengths of the network that are candidates for lifecycle extension works (LEW) ahead of reconstruction.

All other pavements

E/2.2 TRACS and TRASS condition data, obtained from HAPMS, and the additional data described in CS 230 [Ref 5.N] Section 3 shall be collated and reviewed on an annual basis in order to identify lengths of pavement that are showing signs of deterioration.

E/2.3 The review of this data shall be used to select lengths of the network that warrant detailed investigation in order to determine the causes and extent of the deterioration.

NOTE 1 Isolated short (100 m) lengths which are exhibiting slight levels of deterioration are unlikely to require further investigation.

NOTE 2 Lengths that are exhibiting significant levels of deterioration, or adjacent lengths that are exhibiting moderate levels of deterioration, are likely to require further investigation.

TRACS data

E/2.4 For the network review, TRACS condition data (100-m reporting length) shall be obtained from HAPMS using the most recent TRACS length weighted average (LWAVG) data source.

NOTE The HAPMS database contains current and historical TRACS data.

E/2.4.1 TRACS data from earlier surveys may also be used to provide additional information on the rate of change of condition.

NOTE 1 Time series analysis can be useful in determining how quickly pavements are deteriorating.

NOTE 2 Some of the parameters have changed how they are reported over time and it is not appropriate to directly compare values for these parameters.

NOTE 3 Further information on the evolution of the TRACS condition parameters is available to National Highways staff and authorised service providers.

Texture, rutting and eLPV

E/2.5 TRACS data for texture depth, rutting and eLPV shall be assessed against the four condition categories defined in Table E/1.5.

E/2.6 Any 100-m length in condition category 4 shall be assessed as showing signs of deterioration.

E/2.7 Any two 100-m lengths in condition category 3 within 1 km of one another shall be assessed as showing signs of deterioration.

Lane fretting intensity and bump measure

E/2.8 Lane fretting intensity and bump measure shall be reviewed against the corresponding guide values given in Section E/1.

Network visual assessment of CRCPs

E/2.9 The results of the network visual assessment for CRCPs, designed in accordance with CD 226 [Ref 2.N], shall be assessed against the four condition categories defined in Table E/1.16.

E/2.10 Any 100-m length in condition category 2 or higher shall be assessed as showing signs of deterioration.

E/2.10.1 Any 100-m length in condition category 4 should be selected for a renewal pavement investigation in accordance with CD 227 [Ref 3.N].

TRASS data

E/2.11 For the network review, TRASS condition data (100-m reporting length) shall be obtained from HAPMS using the most recent TRASS data source.

NOTE The HAPMS database contains current and historical TRASS data.

E/2.12 The structural condition of each 100-m reporting length shall be assigned one of four levels of network structural condition (NSC) category, as defined in Table E/1.22.

NOTE The NSC categories are used:

  1. in the identification of technically simple pavement schemes;
  2. in the identification of lengths suitable for preventative maintenance;
  3. to potentially reduce the need for deflectograph surveys ( CD 227 [Ref 3.N]).

Identifying lengths suitable for preventative maintenance

E/2.13 A review of the network level condition data described in this document and the characteristic skid coefficient data described in CS 228 [Ref 2.I] shall be used to select lengths of the network that warrant further investigation in order to confirm their suitability for receiving a preventative maintenance treatment.

NOTE Preventative maintenance can extend the service life of an existing thin surface course system.

E/2.14 Lengths suitable for investigation for receiving a preventative maintenance treatment shall meet all of the following criteria:

  1. be surfaced throughout with a thin surface course system (TSCS) greater than five years old;
  2. be free of all signs of visual defects;
  3. TRACS texture depth, rut depth and eLPV all in condition category 1;
  4. TRACS lane fretting intensities all <2;
  5. TRASS NSCs all in category 1 or 2; and,
  6. characteristic skid coefficient (CSC) above investigatory level (IL).

NOTE 1 The initial identification of sites is based on network level data.

NOTE 2 A visual assessment, either a drive-over or a review of video images, can be used to confirm that the length is free of visual defects.

NOTE 3 Assessment of characteristic skid coefficients and investigatory levels is set out in CS 228 [Ref 2.I].

E/2.15 Lengths that are selected from the review shall be subject to laboratory testing to confirm that the TSCS material is suitable to receive a preventative treatment as set out in Section 4 of CD 227 [Ref 3.N].

Identifying technically simple pavement schemes (TSS)

E/2.16 Technically simple pavement schemes (TSS) require renewal of only the surface course and shall be subject to a simplified development and assessment process.

NOTE 1 TSS are lengths of carriageway where there are no structural problems; that is where pavement deterioration is present but is confined to the surface course.

NOTE 2 It is expected that a TSS can consist of a number of contiguous HAPMS sections that each meet the selection criteria set out in Figure E/2.18.

E/2.16.1 The minimum length of a TSS should be 500 m.

E/2.16.2 All running lanes within the HAPMS sections making up the TSS should have the surface course renewed, apart from substantial, continuous lengths of thin surface course systems (TSCS) that are less than five years old.

E/2.16.3 HAPMS sections that do not meet the TSS criteria (i.e. they include some limited areas that have defects requiring deeper treatments) may be included within a TSS provided that the total works costs of the structural repairs, excluding surface course, are less than 10% of the scheme area and less than £100k for the whole scheme.

E/2.17 TSS shall not include replacement of the surface course of hard shoulders (unless they are a running lane), lengths of pavement over underbridges, or rigid pavement sections (including those with overlays).

Checklist and decision process for technically simple pavement schemes

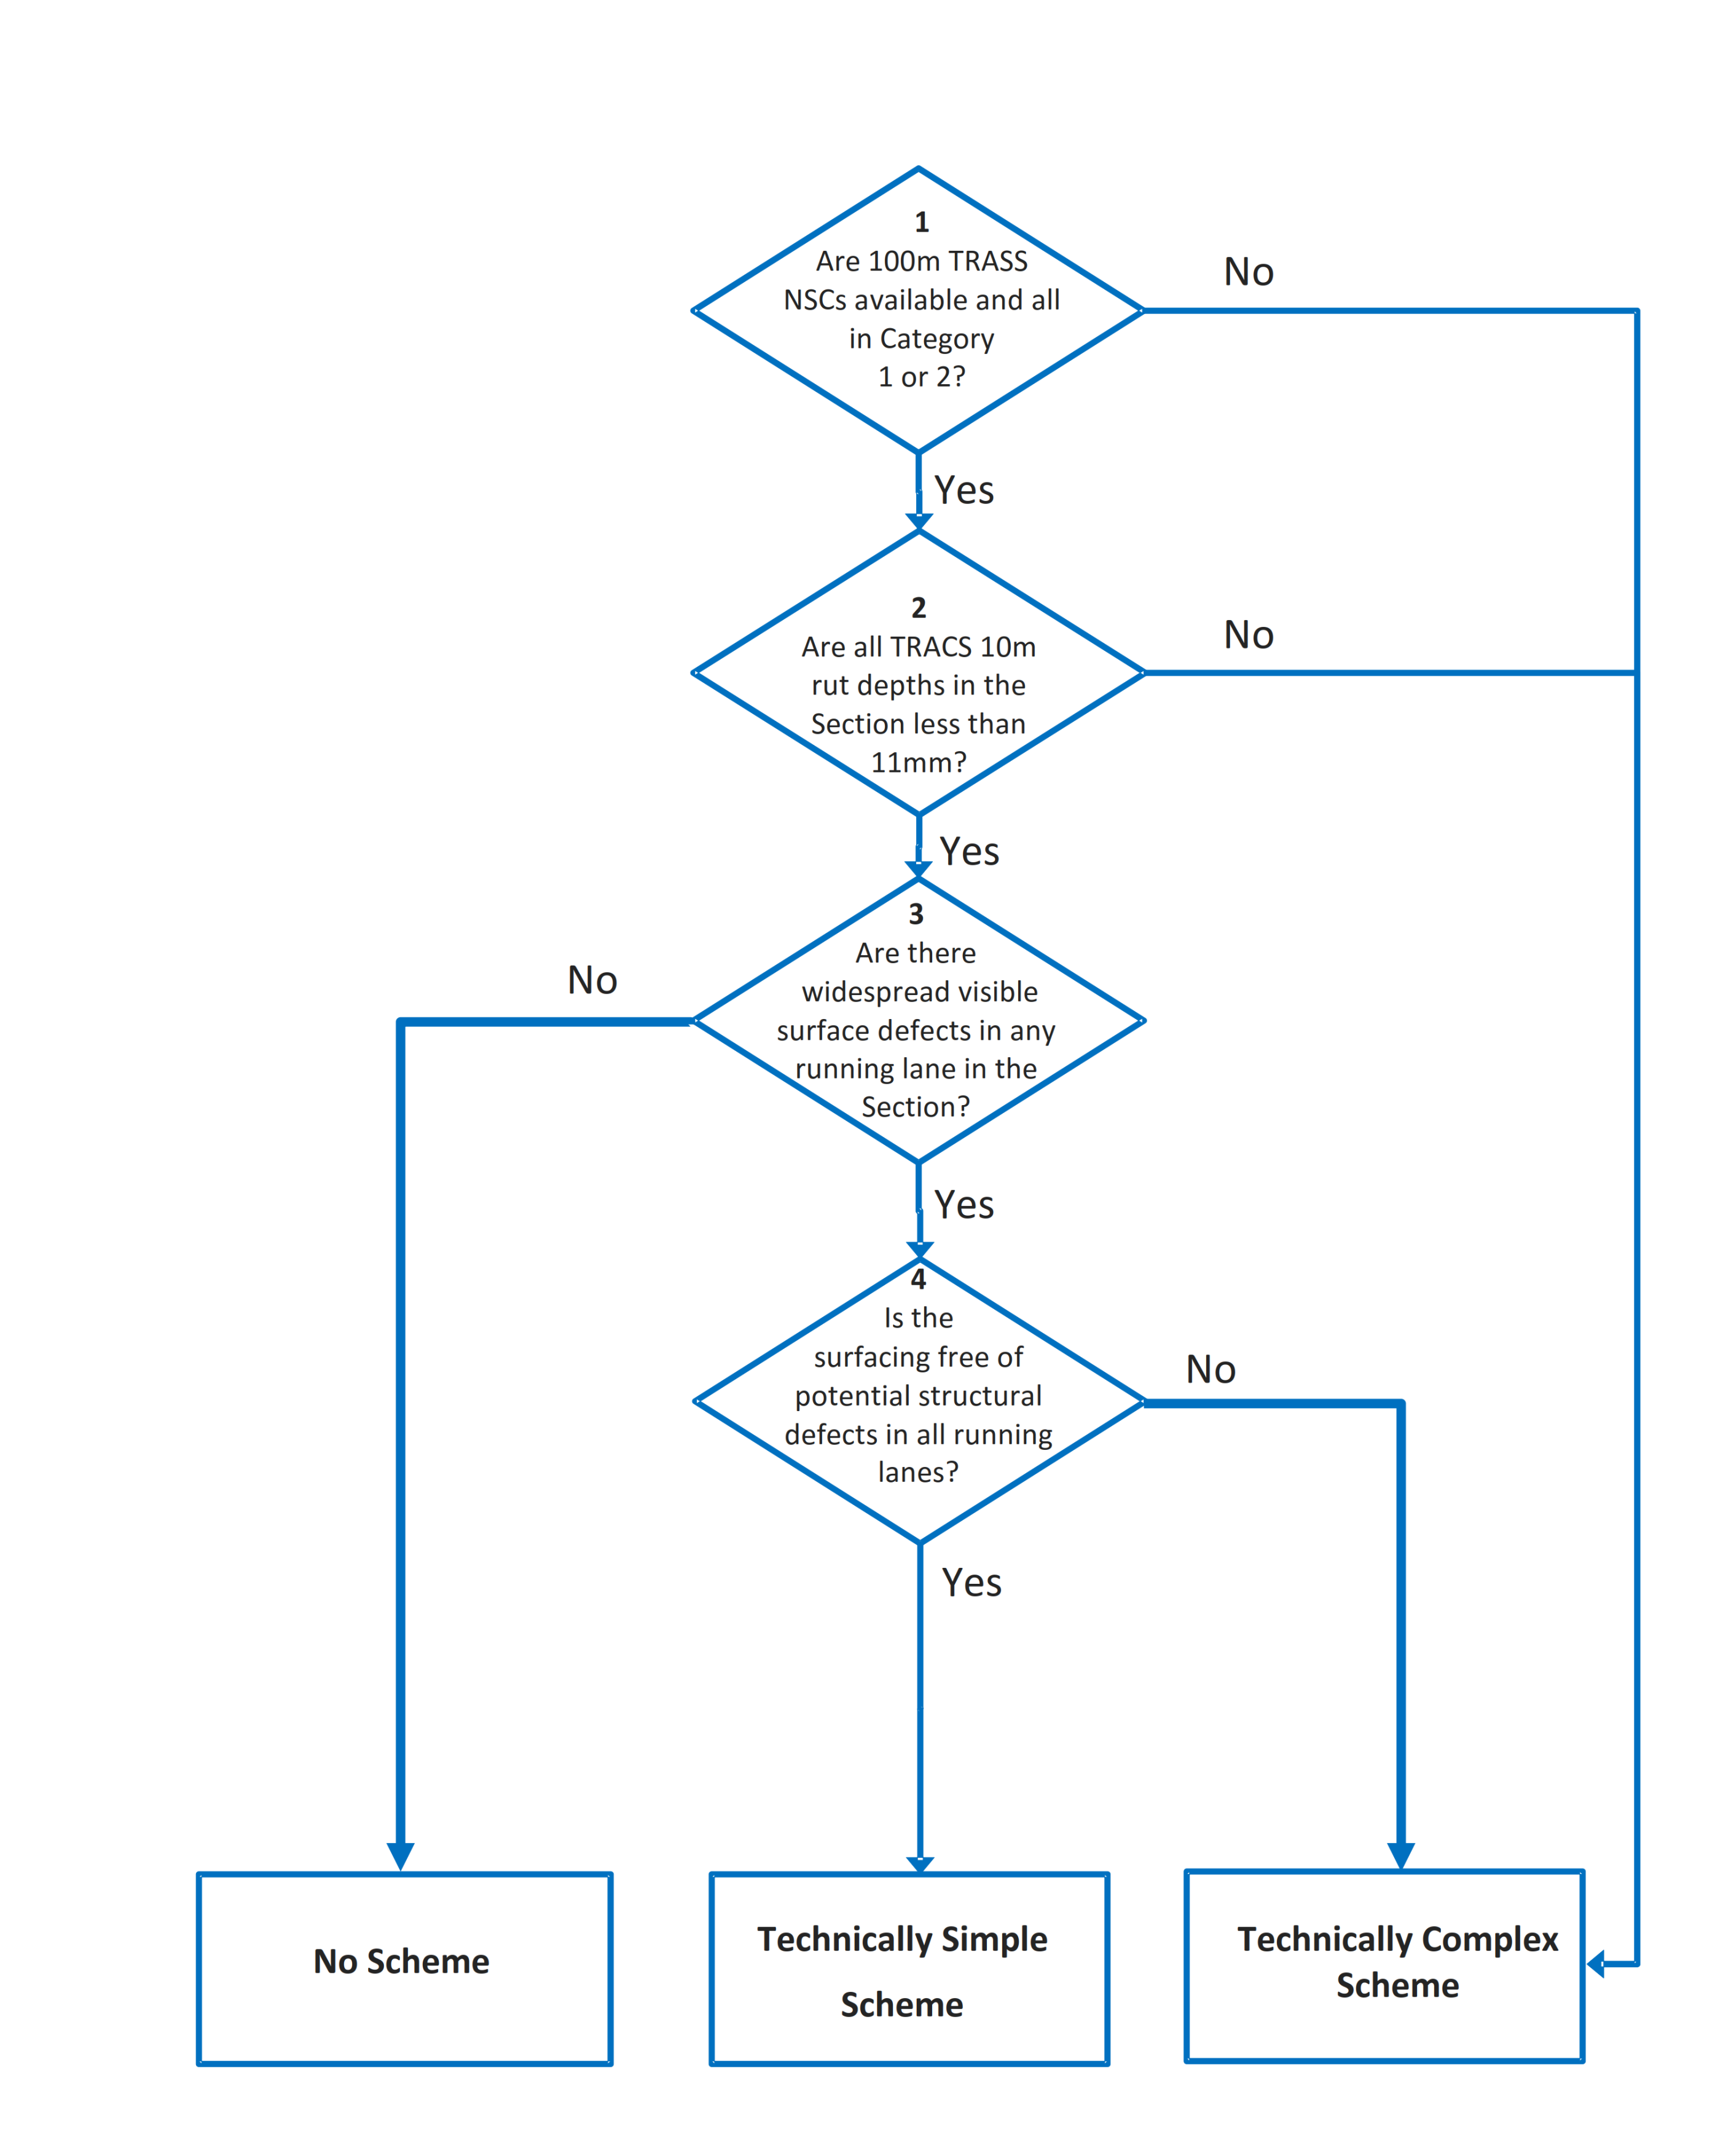
E/2.18 The detailed approach that shall be used for identifying HAPMS sections that are suitable for inclusion within a TSS is set out in the flowchart in Figure E/2.18 and its accompanying decision point notes.

Figure E/2.18 Procedure for identifying HAPMS sections that meet the TSS criteria

NOTE Numbers in the boxes correspond to decision points 1 to 4.

Decision point 1

E/2.19 TSS shall only include lengths of carriageway of flexible pavement construction, that is either flexible with an asphalt base or flexible with an HBM base.

NOTE 1 TRASS NSC categories are only reported for flexible pavements.

NOTE 2 Rigid pavements (that is containing pavement quality concrete), including those with an asphalt overlay, are excluded from treatment within a TSS.

E/2.19.1 HAPMS age and construction data should be ‘sense checked’ and any inconsistencies resolved before proceeding with the categorisation.

NOTE HAPMS reports age and surface type for all surface course layers but these are not always reliable.

E/2.19.2 TRASS NSC categories should be available in lane 1 for the whole section length (except for underbridges).

NOTE TRASS NSC categories can also be reported in other lanes.

E/2.20 All available 100-m TRASS data shall be in NSC category 1 or 2.

E/2.20.1 For sections where TRASS data is not available in lane 1 in HAPMS, deflectograph data (collected within the previous five years) should be used if it is available.

E/2.21 Where the HAPMS deflectograph analysis indicates a strengthening requirement of 40 mm or more, for any length within the section, then it shall be excluded from treatment within a TSS.

Decision point 2

E/2.22 TRACS rutting data shall be reviewed for all lanes that have been surveyed (maximum values on 10-m sections).

E/2.23 All TRACS rut depths shall be less than 11 mm.

Decision points 3 and 4

E/2.24 A visual assessment, either a drive-over or a review of video images, shall be undertaken.

E/2.25 To meet the TSS criteria, the section shall contain no signs of structural defects.

NOTE Examples of visual defects that can indicate the presence of structural problems are cracking (longitudinal, transverse, crazing), surface depressions and pumping.

E/2.25.1 There should be widespread surface-only visual defects present.

NOTE Examples of surface-only defects are fretting, bleeding and chip loss.

E/2.25.2 Thin surface course systems which are less than five years old but contain visible surface defects should be investigated for potential repair under performance guarantee.

Deeper treatments

E/2.26 Where deeper treatments are proposed within a TSS, clear evidence that the work proposed is appropriate shall be presented and form part of the scheme submission.

NOTE 1 Limited areas which require deeper treatments can be included within a TSS.

NOTE 2 The evidence can include results from previous investigations on the scheme.

E/2.27 Where deeper treatments are proposed within a TSS, the area to be treated shall cover less than 10% of the scheme area and have a works cost of less than £100k (excluding the surface course).

E/2.28 Where there is clear evidence that structural deterioration is present then the scheme shall be classed as a technically complex scheme and be investigated in accordance with CD 227 [Ref 3.N].

Design of technically simple pavement schemes

E/2.29 Where the decision is taken to proceed with a technically simple pavement scheme, the surfacing shall be designed in accordance with Section 4 of CD 227 [Ref 3.N].

E/2.30 Any short lengths within the technically simple pavement schemes that require deeper treatment (within the £100k limit) shall be designed in accordance with Section 5 of CD 227 [Ref 3.N].

E/3. Normative references

The following documents, in whole or in part, are normative references for this document and are indispensable for its application. For dated references, only the edition cited applies. For undated references, the latest edition of the referenced document (including any amendments) applies.

Ref. Document
Ref 1.N National Highways. CS 229, 'Data for pavement assessment'
Ref 2.N National Highways. CD 226, 'Design for new pavement construction'
Ref 3.N National Highways. CD 227, 'Design for pavement maintenance'
Ref 4.N National Highways. GG 101, 'Introduction to the Design Manual for Roads and Bridges'
Ref 5.N National Highways. CS 230, 'Pavement maintenance assessment procedure'

E/4. Informative references

The following documents are informative references for this document and provide supporting information.

Ref. Document
Ref 1.I National Highways. CS 126, 'Inspection and assessment of road markings and road studs'
Ref 2.I National Highways. CS 228, 'Skidding resistance'

Appendix E/A. Description of TRACS condition data

E/A1 Introduction

Surveys on the strategic road network in England carried out under the TRAffic-speed condition survey (TRACS) contract commenced in 2000. TRACS surveys are carried out using survey vehicles equipped with lasers, video image collection and inertia measurement apparatus to enable surveys of the road surface condition to be carried out whilst travelling at variable speeds, of up to 100 km/h, to match prevailing traffic, and hence cause minimum disruption to other road users.

As the TRACS contracts have progressed, the parameters measured and reported within HAPMS have changed as technology has moved on. This section provides a short description of each of the main pavement-related parameters reported under the current TRACS contract. More information on HAPMS is available to National Highways staff and authorised service providers.

E/A1.1 Location referencing

All data collected by TRACS survey vehicles are referenced to the network sections. The start and end points of sections are defined by location reference points (LRPs) in HAPMS referencing.

E/A1.2 Geometry

Three measures of road geometry are delivered by the TRACS survey: gradient, crossfall, and radius of curvature. Gradient and crossfall are delivered as percentages, whilst radius of curvature is in metres. These measures are used primarily for the classification of site categories for assigning investigatory levels of skidding resistance (see CS 228 [Ref 2.I]).

E/A1.3 Processing and reporting

TRACS survey data is delivered in raw form as TRACS raw condition data (RCD). The National Highways machine survey pre-processor (MSP) software is used to process the RCD to generate the TRACS base condition data (BCD). The TRACS BCD is loaded into HAPMS. HAPMS provides maintenance engineers with access to the condition data collected from their network, and enables them to identify potential maintenance schemes and to monitor network performance. The TRACS BCD can be queried in HAPMS and reported using the database facilities, and can be displayed against a map background.

E/A2 Texture depth

The surface texture depth measured by TRACS survey vehicles is the coarser element of macrotexture and the finer element of megatexture formed by aggregate particles in the asphalt surfacing or by the brushing or grooving of concrete surfacing. Texture depth contributes to skidding resistance, primarily at medium and high speeds, in two ways. Firstly, it provides drainage paths to allow water to be removed rapidly from the tyre/road interface. Secondly, the projections, which contribute to hysteresis losses in the tyre, are an important factor in the braking process.

The MSP software calculates sensor-measured texture depth (SMTD) from the raw texture profile measurements collected by TRACS survey vehicles for the near side wheel-track, and averages them over 10-m lengths for storage as base data within HAPMS.

E/A3 Rut depth

To measure rut depth, TRACS survey vehicles record the transverse profile of the road surface at 200 points over a minimum width of 3.8 m using lasers. They also record the road marking profile over a minimum width of 3.8 m and at the same transverse and longitudinal locations as the transverse profile. The 200 transverse profile measurements are processed in MSP, which uses an algorithm to simulate placing a notional 2-m straight edge on the recorded transverse profile, and measuring the largest deviation from the straight edge to the transverse profile, excluding any measurements made on road markings. This calculation is carried out for each wheel-track. MSP calculates the average of the individual rut depths for each wheel-track over 10-m lengths for storage within HAPMS.

The transverse profile measurement method of rut depth determination used by TRACS vehicles has been shown to be highly comparable with the measurements made using a conventional straight edge and wedge.

It is recommended that, where any length has been identified for further investigation as a result of deep rut depths, that comparison be made between the left rut and right rut length weighted average values contained within HAPMS. This is to check that there are no excessive differences which could be caused by the inclusion of the edge line in the left or right rut measurements.

E/A4 Enhanced longitudinal profile variance (eLPV) and bump measure

E/A4.1 eLPV

The main parameter currently used for the assessment of ride quality, or profile unevenness, is the enhanced longitudinal profile variance (eLPV) of individual deviations of the profile relative to a datum obtained by removing (or filtering) longer wavelengths from the measured longitudinal profile. This parameter was introduced in June 2004 and uses sophisticated filtering which removes the effects of the pavement geometry (gradient, crossfall and curvature), which had previously caused high levels of variance at, for example, the approaches to roundabouts. The previous simpler method of filtering produced the parameter longitudinal profile variance (i.e. unenhanced).

The eLPV value reflects the unevenness associated with profile features that are equal to or less in wavelength than the length of the filter used to calculate the eLPV. For example, the variance of deviations from a 3-m filter reflects the unevenness of profile features with wavelengths equal to or less than approximately 3 m.

The measurement of profile unevenness can be used to investigate the ride quality of the pavement. The short, medium and long wavelength features that are found to relate with the perceived effect on vehicle ride are represented by variance from 3 m, 10 m and 30 m filters respectively. The 3 m, 10 m and 30 m eLPV values are calculated from the TRACS longitudinal profile measurements by MSP and averaged over 10-m lengths for storage within HAPMS.

Extremes of 10-m eLPV may arise from poor reinstatements along the wheel-track, the presence of high and/or variable levels of rutting, and bay length irregularities (in concrete roads). High levels of 30 m enhanced longitudinal profile variance may be associated with subsidence. Changes of crossfall along the length of a road may also result in slightly higher 30 m eLPV being reported.

High levels of profile unevenness do not only affect ride quality. High levels of profile unevenness, particularly in the 3-m and 10-m wavelength ranges, have been shown to contribute to increased dynamic loading of the pavement, hence accelerating the deterioration of the road pavement. Extremes of profile unevenness can also lead to increased stopping distances, and can have an adverse effect on vehicle manoeuvrability and safety.

Research carried out on TRACS measurements has shown that TRACS survey vehicles may provide eLPV data having lower levels of accuracy when surveying at slow speed, or under conditions of significant acceleration or (more commonly) deceleration. To reduce the occurrence of low accuracy data, limits have been specified for the TRACS surveys for speed and acceleration/deceleration beyond which the data is considered invalid. Where these limits have been exceeded, the data is marked as "unreliable" in the TRACS base eLPV data. The presence of a significant proportion of unreliable values within any 100-m length results in missing values when the data is expressed as 100m-length weighted averages in HAPMS.

To distinguish between moving average LPV (reported prior to 1st June 2004) and eLPV, the TRACS length weighted averages data source in HAPMS provides an additional label for the LPV data called “enhanced”. Where the label is not present this indicates that the value reported in the HAPMS TRACS length weighted averages data source is the old moving average LPV.

E/A4.2 Bump measure

Research has shown that road users are also sensitive to short-length “bump” features that cause jolt-like sensations within the vehicle. These features are not effectively identified using the eLPV measure. Therefore a measure, called the “bump measure” was developed. The bump measure has been designed to identify lengths of pavement containing short defects (“bumps”), such as sunken ironwork, potholes, and poor joints. Such defects can cause jolting discomfort to the road user.

The bump measure is calculated from the longitudinal profile, and initially reported over 10-m lengths. It reports either 0 or 1 for each reporting length, with a 1 indicating that the length contains one or more bumps. ‘Left bump’ indicates whether there is one or more bumps in the left wheeltrack and ‘right bump’ indicates whether there is one or more bumps in the right wheeltrack.

TRACS length-weighted average bump measure is reported over 100-m lengths and has a value of 0 or 1, where a 1 indicates that the length contains one or more bumps. The bump measure does not give any indication of the number of bumps in the reporting length.

E/A5 Lane fretting intensity

TRACS "lane fretting" has been reported since January 2014. This replaced the TRACS "fretting" parameter which was delivered between June 2004 and January 2014. The older fretting parameter provided an indication of the amount of fretting present on HRA surfaced pavements only and was calculated from the texture profile measured in the left wheelpath.

TRACS lane fretting has been introduced to improve the ability to identify fretting by using multiple lasers across the width of the survey vehicle to provide a measure of the amount of fretting present on the whole lane width. The parameter uses a different approach to calculating fretting so that the measure is able to identify fretting on all asphalt surface types. The values reported by the measure are not comparable to the values reported by the previous single line measure.

The lane fretting algorithm reports the intensity of lane fretting in the range 0 to 625. In general, the higher the value of the fretting parameter, the more likely it is that there is fretting present at that location on the network, and the more severe that fretting is likely to be. However, the way the parameter is calculated means that the values actually quantify how different a local part of the pavement is from its surroundings.

Significant weight should not be unduly applied to moderate proportional differences in the lane fretting Intensity. For example it should not be assumed that lengths with lane fretting of 8 are twice as fretted as lengths with lane fretting of 4. A value of lane fretting of 17.5 in one location is not necessarily more fretted than a value of 16.4 in another place – both locations are probably fretted and should be investigated.

It may not be possible to calculate a value of lane fretting intensity where the survey measurements include a large area of road markings, or where a number of surfacing changes were identified within a short distance of one another, or where the driving line of the survey vehicle deviated from the required survey line and the data were flagged as being out of line by the survey contractor. The values are not to be compared directly with measures obtained from manual visual condition surveys.

Appendix E/B. TRAffic-speed structural condition surveys (TRASS)

E/B1 Introduction

Non-invasive information on the structural condition of pavements can be provided from measuring the deflection response under load. These measurements have been provided by the deflectograph and the falling weight deflectometer (FWD). However these devices employ slow-moving (2.5 km/h) or static measurement techniques that require traffic management and cause traffic disruption, which is not ideal for routine network-level assessment.

In 2005, National Highways acquired a traffic speed deflectometer (TSD), developed in Denmark. Following research and development into the operation of this equipment, network-level surveys commenced with this machine on the English strategic road network in 2010 as part of National Highways' first TRAffic-speed structural survey (TRASS) contract.

E/B1.1 Location referencing

All data collected by the TSD are referenced to the network sections. The start and end points of sections are defined by location reference points (LRPs) in HAPMS referencing.

E/B1.2 Processing and reporting

TRASS data is delivered as raw condition data (RCD). National Highways' machine survey pre-processor (MSP) software is then used to process the RCD, including checking of the data quality, to generate TSD base condition data (BCD), which includes TSD slopes derived from the velocity sensor measurements averaged over one-metre lengths. The TSD BCD can be queried in HAPMS and reported using the database facilities, and can be displayed against a map background.

E/B2 TSD data collection / operation

The TSD comprises a complex array of instruments and recording equipment within an insulated, temperature-controlled, steel container mounted on a single rear axle trailer assembly having a rear axle load of approximately 10 tonnes.

Patented technology uses Doppler lasers, mounted in a stiff frame, to measure the velocity of the deflection of the road surface at three positions in front of the loaded nearside twin rear wheels of the trailer. A fourth velocity sensor, well in front of the loaded wheels, enables corrections to be made for the movement of the vehicle. Other motion sensors enable further corrections for unwanted movement of the mounting frame. Currently the equipment operates at a survey speed of between 50 and 80 km/h, with a target speed of 70 km/h.

The vertical deflection velocity measured at each point is scaled by the instantaneous survey velocity to provide what is known as the TSD “slope”, which is an indicator of the structural strength of the road. This slope is sampled at around 1000 times a second (every 19 mm of travel at 70 km/h) and reported over an average length of one metre.

Although the TSD does not measure the same response to load as the deflectograph, research has shown that a fairly strong relationship exists between the TSD slope and the peak deflection measured by the deflectograph in the nearside wheel-track. The research and development has also continued to identify and implement improvements to the machine operating procedures and its systems to support routine network surveys. These include the addition of a climate control system to reduce the influence of thermal gradients on the measuring beam and more robust distance and survey velocity measuring systems.

TSD surveys are carried out in accordance with standard operating procedures intended to ensure that climatic and machine conditions are suitable for reliable data to be obtained. For example, surveys do not provide valid data when the road surface is wet. The valid operating speed of the TSD has constrained upper and lower limits. This is so that data that is sufficiently robust for network level use can be obtained without need for correction of the results for the effect of vehicle speed.

E/B3 Data analysis

The analysis of TRASS data is carried out within HAPMS and creates outputs at a base reporting length of 100 m. If the total length of a HAPMS section is not an exact multiple of 100 m then an output is also provided for the final sub-100 m length of the section. The analysis procedure uses an algorithm to convert each of the 1-m TSD slopes in the reporting length to an estimated peak deflectograph value.

The corresponding construction information held in HAPMS is used to calculate the “characteristic base type” (CBT) for each 100-m length. This can be “BITS”, “CEMT” or “GNCA” following the same rules for classifying base types as used for deflectograph analysis in HAPMS as described in CS 229 [Ref 1.N]. The CBT of a reporting length is defined as the base type present for the majority of that length. The estimated peak deflectograph values together with the construction and traffic information are used to calculate the network structural condition (NSC) category as described in Section E/2.

It should be noted that at the present time the analysis does not include correction of TSD slope values for the influence of survey speed or pavement temperature.

Further details of the analysis are provided in the HAPMS documentation, available to National Highways staff and authorised service providers.

E/B4 Data quality

The analysis of TRASS survey data is only valid for flexible pavements, with the robustness of the reported results being critically dependent on the availability of accurate construction and traffic data in HAPMS. Service providers should therefore ensure that this information is sufficiently accurate before using TRASS data in the planning of scheme level investigations.

A null NSC category is reported for 100-m lengths when it is not possible for HAPMS to complete the analysis procedure satisfactorily. This includes where valid TSD data are not available for the reporting length. This occurs for HAPMS sections where TRASS surveys have not been undertaken (for example roundabouts) or where the TRASS survey data is invalid (for example if they are undertaken outside of the required speed range). In these cases the TSD slope value is also reported as "null".

While the reported 85th percentile slope values are not currently to be used for maintenance assessment planning, their presence is an indication that valid TRASS data has been collected for the corresponding 100-m length. It is possible for valid TSD data to be present but the NSC category to be reported as "null". This occurs where pavement quality concrete is present, where the construction is too thin to meet the classification criteria for BITS or CEMT base types, or where there is a lack of valid traffic information.

Where the NSC category is reported as null, the construction and traffic data held in HAPMS should be reviewed and updated if appropriate before rerunning the TRASS analysis procedure in HAPMS.

Skip to content

Design Manual for Roads and Bridges

Pavement

Inspection & Assessment

CS 230 - NINAA Northern Ireland National Application Annex for Pavement maintenance assessment procedure

(formerly HD 30/08)

Version 0.0.1

Summary

This National Application Annex contains the Department for Infrastructure Northern Ireland-specific requirements for routine, network-level surveys of pavement surface condition and structural condition.

Feedback and Enquiries

Users of this document are encouraged to raise any enquiries and/or provide feedback on the content and usage of this document to the dedicated team in the Department for Infrastructure, Northern Ireland. The email address for all enquiries and feedback is: dcu@infrastructure-ni.gov.uk

This is a controlled document.

Latest release notes

Document Code Version number Date of publication of relevant change Changes made to Type of change
CS 230 - NINAA 0.0.1 December 2022 Northern Ireland NAA Incremental change to notes and editorial updates
[PUB. Rev. 0.0.1: Change of brand from Highways England to National Highways plus minor editorial changes. Department for Infrastructure Northern Ireland National Application Annex to CS 230.

Previous versions

Document Code Version number Date of publication of relevant change Changes made to Type of change
CS 230 0 March 2020

Foreword

Publishing information

This document is published by National Highways on behalf of the Department for Infrastructure, Northern Ireland.

Contractual and legal considerations

This document forms part of the works specification. It does not purport to include all the necessary provisions of a contract. Users are responsible for applying all appropriate documents applicable to their contract.

Introduction

Background

This National Application Annex gives the Department for Infrastructure Northern Ireland-specific requirements for routine, network-level surveys of pavement surface condition and structural condition. It sets out the requirements for reviewing the outputs from these surveys in order to identify lengths of carriageway that are potentially in need of maintenance and that require a detailed assessment. It does not cover the routine measurement of skidding resistance which is dealt with in CS 228 [Ref 6.N].

Assumptions made in the preparation of this document

The assumptions made in GG 101 [Ref 3.N] apply to this document.

Abbreviations

Abbreviations
Abbreviation Definition
BCD Base condition data
CBT Characteristic base type
CRCP Continuously reinforced concrete pavement
eLPV Enhanced longitudinal profile variance
HAPMS National Highways' pavement management system
HBM Hydraulically bound mixture
HFS High friction surfacing
HRA Hot rolled asphalt
LPV Longitudinal profile variance
LW Length weighted
LWAVG Length weighted average
LRP Location reference point
MSP Machine survey pre-processor
NSC Network structural condition
PMS Pavement management system
RCD Raw condition data
SMTD Sensor measured texture depth
TRACS TRAffic-speed condition survey

NI/1. Network level surveys

Surface condition surveys (CS 230, 2.2)

NI/1.1 Surface condition surveys of carriageways on the motorway and trunk road network shall preferably be carried out at traffic speed.

NI/1.1.1 Surface condition surveys may be undertaken on foot in agreement with the Department for Infrastructure.

Surface Condition Assessment of the National Network of Roads (SCANNER)

NI/1.2 On the road network in Northern Ireland, traffic-speed surveys shall be carried out on designated roads using the Surface Condition Assessment of the National NEtwork of Roads (SCANNER) system.

NI/1.3 The thresholds, weightings and factors as set out in UKPMS Technical Note 42 Part 2, published on the UK Roads Liaison Group website (see UKRLG TN 42 [Ref 7.N], shall be used in the RCI calculations.

NOTE This survey system had been developed by the UK Roads Board to provide a consistent method of measuring the surface condition of local authority carriageways, using automated road condition survey machines, throughout the UK . Full details are given in the SCANNER Specification [Ref 5.N]and User Guide published by the UK Roads Board.

NI/1.4 Before a survey vehicle can be used to carry out a SCANNER survey, it shall pass accreditation tests each year and be operated with a defined quality assurance procedure with an independent auditor.

NI/1.5 The survey data produced by the survey machines shall be loaded into the pavement management system (PMS) for highway maintenance and management purposes.

TRACS contract and parameters

NI/1.6 Network level (TRACS) surface condition surveys on designated roads of the Northern Ireland's motorway and all-purpose trunk road network shall be undertaken as per the requirements of the respective network management contract, centrally managed by the Department for Infrastructure.

NOTE 1 TRACS stands for TRAffic-speed Condition Survey.

NOTE 2 The coverage and frequency of surveys are set out in the respective network management contract.

NI/1.7 TRACS vehicles shall be accredited and approved for use by the Overseeing Organisation for use on their network.

NI/1.8 TRACS surveys shall be controlled by a detailed quality audit procedure for the surveys, which includes regular independent checks to maintain quality assurance.

NI/1.9 TRACS surveys shall provide the following information about the pavement:

  1. geometry (gradient, crossfall, radius);
  2. rutting;
  3. 3 m, 10 m and 30 m enhanced longitudinal profile variance (eLPV);
  4. bump measure;
  5. sensor measured texture depth (SMTD);
  6. lane fretting intensity (reported on asphalt surfaces only);
  7. noise;
  8. surface type; and,
  9. cracking (reported on asphalt surfaces only).

NOTE 1 TRACS data is available in the PMS and is referenced to the PMS network.

NOTE 2 The road geometry measures are used in the classification of site categories for assigning investigatory levels of skidding resistance provided in DMRB CS 228 [Ref 6.N].

NOTE 3 The TRACS cracking measure was introduced in 2018 and there are currently no guidance levels for interpretation of this parameter.

NOTE 4 TRACS also measures retroreflectivity of road markings. Inspection and maintenance of road markings is covered in CS 126 [Ref 1.I].

NOTE 5 TRACS also collects high quality downward and forward facing images. These images provide information that can be used for detailed visual condition surveys of the carriageway as described in CS 229 [Ref 1.N] and for the network visual assessment of rigid pavements, as described in this document.

NOTE 6 Detailed guidance on the TRACS parameters is provided in the TRACS guidance documents available through National Highways staff at: http://hawacphap013/hapms/.

TRACS texture depth, rut depth and eLPV

TRACS condition categories

NI/1.10 TRACS texture depth, rut depth and enhanced longitudinal profile variance (eLPV) data shall be assessed against the four condition categories defined in Table NI/1.10.

Table NI/1.10 Condition categories for TRACS texture depth, rut depth and eLPV
Condition category Definition
1 Sound – negligible deterioration.
2 Some deterioration – low level of concern.
3 Moderate deterioration – warning level of concern.
4 Severe deterioration – intervention level of concern.

Rut depth

NI/1.11 The TRACS rut depth levels that shall be used to define condition category are given in Table NI/1.11.

Table NI/1.11 Condition categories for TRACS rutting measurements (100m lengths)
Condition
category
Maximum rut (mm)
1 <6
2 6≥ [rut] <11
3 11≥ [rut] <20
4 ≥20

NOTE 1 The categories apply to the 100-m TRACS length weighted (LW) average maximum rut measurement as reported in the PMS.

NOTE 2 Rutting is reported on all surface types.

Texture depth

NI/1.12 The TRACS texture depth levels that shall be used to define condition category are given in Table NI/1.12.

Table NI/1.12 Condition categories for TRACS texture depth measurements (100m lengths)
Category Texture depth (mm)
High friction
surfacing (HFS)
All other surfaces
1 >0.6 >1.1
2 ≤0.6 1.1≤ [SMTD] >0.8
3 N/A 0.8 ≤ [SMTD] >0.4
4 N/A ≤0.4

NOTE 1 The categories apply to the 100-m TRACS length weighted (LW) average texture depths as reported in the PMS.

NOTE 2 Texture is reported on all surface types.

NOTE 3 Changes in texture depth can indicate a potential loss of skid resistance. Advice on the interpretation of texture depth data in connection with skid resistance is given in CS 228 [Ref 6.N].

NOTE 4 Lower texture depth values are applied to HFS due to the different way in which skid resistance is provided by these materials.

NOTE 5 The texture depth of HFS can only be in condition category 1 or 2.

Enhanced longitudinal profile variance (eLPV)

NI/1.13 The TRACS eLPV levels that shall be used to define condition category are given in Tables NI/1.13a to NI/1.13c.

Table NI/1.13a Condition categories for eLPV on motorways and rural dual carriageways (100m lengths)
Category Enhanced
longitudinal profile variance (mm
2)
3 m 10 m 30 m
1 <0.7 <1.6 <22
2 0.7≤ [eLPV] <2.2 1.6 ≤ [eLPV] <6.5 22≤ [eLPV] <66
3 2.2≤ [eLPV] <4.4 6.5 ≤ [eLPV] <14.7 66 ≤ [eLPV] <110
4 ≥4.4 ≥14.7 ≥110
Table NI/1.13b Condition categories for eLPV on urban dual carriageways and rural single carriageway roads (100 m lengths)
Category Enhanced
longitudinal profile variance (mm
2)
3 m 10 m 30 m
1 <0.8 <2.8 <30
2 0.8≤ [eLPV] <2.2 2.8 ≤ [eLPV] <8.6 30 ≤ [eLPV] <75
3 2.2≤ [eLPV] <5.5 8.6 ≤ [eLPV] <22.8 75 ≤ [eLPV] <121
4 ≥5.5 ≥22.8 ≥121
Table NI/1.13c Condition categories for eLPV on urban single carriageway roads (100m lengths)
Category Enhanced
longitudinal profile variance (mm
2)
3 m 10 m 30 m
1 <1.4 <6.1 <48
2 1.4 ≤ [eLPV] <3.8 6.1 ≤ [eLPV] <18.3 48 ≤ [eLPV] <97
3 3.8 ≤ [eLPV] <9.3 18.3 ≤ [eLPV] <36.6 97 ≤ [eLPV] <193
4 ≥9.3 ≥36.6 ≥193

NOTE 1 The categories apply to the 100-m TRACS length weighted (LW) average maximum eLPV values as reported in the PMS.

NOTE 2 The three eLPV measures reported in the PMS indicate the level of profile unevenness within wavelength ranges less than or equal to 3 m, 10 m and 30 m. These values are broadly correlated to levels of ride comfort (ride quality).

NOTE 3 The eLPV values are set to reflect the standard of ride quality required on different types of road. For example, motorways require a better standard of ride quality than urban single carriageways.

NOTE 4 The road classifications are based on the road classifications in the PMS.

TRACS lane fretting intensity

NI/1.14 TRACS lane fretting Intensity shall be assessed against the guidance values shown in Table NI/1.14.

Table NI/1.14 Guidance values for TRACS lane fretting intensity (100m lengths)
Description Lane fretting intensity
Very low or no fretting <2
Likely to be low fretting over long lengths
or
moderate fretting over a short length
2≤ [lane fretting] <10
Likely to be moderate fretting over long lengths
or
severe fretting over a short length
10≤ [lane fretting] <20
Likely to be severe patches of fretting ≥20

NOTE 1 The categories apply to the 100-m TRACS length weighted (LW) average lane fretting intensity values as reported by HAPMS.

NOTE 2 TRACS lane fretting intensity applies to all asphalt surfaces.

NOTE 3 TRACS lane fretting intensity is reported within the range 0 to 625.

TRACS bump measure

NI/1.15 The TRACS bump measure shall be used to identify lengths containing short defects ("bumps") that are not effectively identified from eLPV.

NOTE 1 The parameter is reported as 100-m TRACS length weighted average bump measure.

NOTE 2 "Bumps" can cause jolt-like sensations within vehicles. Examples of "bumps" include sunken ironwork, potholes and poor transverse joints.

NOTE 3 The bump measure is reported as either 0 or 1. 1 indicates that the length contains one or more "bumps".

TRACS surface type and noise

NI/1.16 TRACS surface type and noise shall be used to provide additional information about lengths of pavement that have been identified as potentially being in need of maintenance.

NI/1.16.1 The TRACS surface type provides a prediction of the surface type based on texture data and luminosity of the surface. The measure may be used to cross check the accuracy of the surface construction records in the PMS.

NI/1.16.2 The TRACS noise measure provides a prediction of the noise levels generated by the surface/tyre interaction based on texture and the TRACS surface type. The noise measure may be used to aid the investigation of noise levels.

TRACS network visual condition assessment of rigid pavements

NI/1.17 TRACS downward facing images shall be reviewed and used to carry out a network visual condition assessment of each running lane for all jointed rigid pavements and continuously reinforced concrete pavements (CRCP).

NOTE 1 For jointed rigid pavements, the assessment is based on the percentage of bays that have cracked, broken or been replaced in each 100-m length in each lane.

NOTE 2 For jointed unreinforced pavements, a bay is considered to be cracked or broken if it contains one or more of the following defects:

  1. a crack >0.5 mm wide crossing a bay transversely or longitudinally;
  2. an intersection of transverse and longitudinal cracks;
  3. wide corner cracking.

NOTE 3 For jointed reinforced pavements, a bay is considered to be cracked or broken when the total length of cracks (>1.5 mm wide) exceeds the width of the bay.

NOTE 4 For CRCP, the assessment is based on the number of significant defects per 100-m length in each lane (see CS 229 [Ref 1.N]] for the definition of significant defects).

NI/1.18 A procedure shall be put in place for reviewing the network at least once every three years.

NOTE The review can be done by reviewing one third of the network each year or all of the network every three years.

NI/1.19 The level of visual defects that shall be used to define condition category are given in Table NI/1.19.

Table NI/1.19 Network visual assessment categories for rigid pavements (100m lengths)
Visual
condition
category
Description Unreinforced jointed concrete pavement (URC) Reinforced jointed concrete pavement (JRC) CRCP
Percentage of cracked, broken
or replaced bays per 100 m
Number of significant
defects per 100 m
1 Low level of deterioration >0 to ≤ 10 >0 to ≤ 15 >0 to ≤ 5
2 Moderate level of deterioration >10 to ≤ 20 >15 to ≤ 30 >5 to ≤ 10
3 High level of deterioration >20 to ≤ 30 >30 to ≤ 50 >10 to ≤ 15
4 Severe level of deterioration – intervention level of concern >30 >50 >15

NOTE 1 Categories apply to each 100-m length in each lane in each PMS section.

NOTE 2 The assessment applies to all pavements with a concrete surfacing and to all rigid pavements with asphalt cover of 50 mm or less.

NI/1.20 The results of the assessment shall be uploaded to the PMS.

Structural condition surveys (CS 230, 2.3)

Deflectograph surveys

NI/1.21 Deflectograph surveys shall be carried out in accordance with CS 229 [Ref 1.N] and at the frequency prescribed in network management contracts, for designated roads, or by the Overseeing Organisation's policy for roads managed by the road authority.

NI/1.22 All deflectograph survey data shall be processed centrally through the PMS using the most recent traffic and construction data.

NOTE Further details are available from the Overseeing Organisation.

NI/2. Review of data (CS 230, 4.1)

NI/2.1 SCANNER and deflectograph condition data, obtained from the Pavement Management System (PMS), and the additional data described in CS 230 [Ref 4.N]and CD 227 [Ref 2.N] shall be collated and reviewed on an annual basis in order to identify lengths of pavement that are showing signs of deterioration.

NI/2.2 TRACS condition data, where relevant, and the additional data described in DMRB CD 227 [Ref 2.N] shall be collated and reviewed on an annual basis in order to identify lengths of pavement that are showing signs of deterioration.

NI/2.3 The review of this data shall be used to select lengths of the network that warrant detailed investigation in order to determine the causes and extent of the deterioration.

NOTE 1 Isolated short (100 m) lengths which are exhibiting slight levels of deterioration are unlikely to require further investigation.

NOTE 2 Lengths which are exhibiting significant levels of deterioration or adjacent lengths that are exhibiting moderate levels of deterioration are likely to require further investigation.

TRACS data

NI/2.4 The PMS database contains current and historical TRACS data. For the network review, TRACS condition data (100-m reporting length) shall be obtained from the PMS using the most recent TRACS length weighted average (LWAVG) data source.

NI/2.4.1 TRACS data from earlier surveys may also be used to provide additional information on the rate of change of condition.

NOTE 1 Time series analysis can be useful in determining how quickly pavements are deteriorating.

NOTE 2 Some of the parameters have changed how they are reported over time and it is not appropriate to directly compare values for these parameters.

NOTE 3 Further information on the evolution of the TRACS condition parameters is available through contacting National Highways.

Texture, rutting and eLPV

NI/2.5 TRACS data for texture depth, rutting and eLPV shall be assessed against the four condition categories defined in Table NI/1.5.

NI/2.6 Any 100-m length in condition category 4 shall be assessed as showing signs of deterioration.

NI/2.7 Any two 100-m lengths in condition category 3 within 1 km of one another shall be assessed as showing signs of deterioration.

Lane fretting intensity and bump measure

NI/2.8 Lane fretting intensity and bump measure shall be reviewed against the corresponding guide values given in Section NI/1.

Network visual assessment of rigid pavements

NI/2.9 The results of the network visual assessment for rigid pavements shall be assessed against the four condition categories defined in Table NI/1.14.

NI/2.10 Any 100-m length in condition category 2 or higher shall be assessed as showing signs of deterioration.

NI/2.10.1 Any 100-m length in condition category 4 should be selected for further investigation.

NI/3. Normative references

The following documents, in whole or in part, are normative references for this document and are indispensable for its application. For dated references, only the edition cited applies. For undated references, the latest edition of the referenced document (including any amendments) applies.

Ref. Document
Ref 1.N National Highways. CS 229, 'Data for pavement assessment'
Ref 2.N National Highways. CD 227, 'Design for pavement maintenance'
Ref 3.N National Highways. GG 101, 'Introduction to the Design Manual for Roads and Bridges'
Ref 4.N National Highways. CS 230, 'Pavement maintenance assessment procedure'
Ref 5.N UK Roads Leadership Group. https://ukrlg.ciht.org.uk/ukrlg-home/guidance/road-condition-information/data-collection/scanner/. SCANNER Specification, 'SCANNER survey for Local Roads User Guide and Specification Volume User Guide and Specification (Volumes 1 to 5)'
Ref 6.N National Highways. CS 228, 'Skidding resistance'
Ref 7.N UK Roads Leadership Group. www.ciht.org.uk/ukrlg. UKRLG TN 42, 'UK Pavement Management System - Northern Ireland visual survey PI guidance notes for UKPMS Developers'

NI/4. Informative references

The following documents are informative references for this document and provide supporting information.

Ref. Document
Ref 1.I National Highways. CS 126, 'Inspection and assessment of road markings and road studs'

Appendix NI/A. Description of TRACS condition data

NI/A1 Introduction

TRACS surveys are carried out using survey vehicles equipped with lasers, video image collection and inertia measurement apparatus to enable surveys of the road surface condition to be carried out whilst travelling at variable speeds, of up to 100km/h, to match prevailing traffic, and hence cause minimum disruption to other road users.

This section provides a short description of each of the main pavement-related parameters reported under the current TRACS contract.

NI/A1.1 Location referencing

All data collected by TRACS survey vehicles are referenced to the network sections. The start and end points of sections are defined by location reference points (LRPs) for referencing purposes.

NI/A1.2 Geometry

Three measures of road geometry are delivered by the TRACS survey: gradient, crosswalk, and radius of curvature. Gradient and crossfall are delivered as percentages, whilst radius of curvature is in metres. These measures are used primarily for the classification of site categories for assigning investigatory levels of skidding resistance (see DMRB CS 228 [Ref 6.N]).

NI/A1.3 Processing and reporting

TRACS survey data is delivered in raw form as TRACS raw condition data (RCD). The machine survey pre-processor (MSP) software is used to process the RCD to generate the TRACS base condition data (BCD). The TRACS BCD is loaded into the PMS. The PMS provides maintenance engineers with access to the condition data collected from their network, and enables them to identify potential maintenance schemes and to monitor network performance. The TRACS BCD can be queried in the Pavement Management System (PMS) and reported using the database facilities, and can be displayed against a map background.

NI/A2 Texture depth

The surface texture depth measured by TRACS survey vehicles is the coarser element of macrotexture and the finer element of megatexture formed by aggregate particles in the asphalt surfacing or by the brushing or grooving of concrete surfacing. Texture depth contributes to skidding resistance, primarily at medium and high speeds, in two ways. Firstly, it provides drainage paths to allow water to be removed rapidly from the tyre/road interface. Secondly, the projections, which contribute to hysteresis losses in the tyre, are an important factor in the braking process.

The MSP software calculates sensor measured texture depth (SMTD) from the raw texture profile measurements collected by TRACS survey vehicles for the near side wheel-track and averages them over 10-m lengths for storage as base data within the PMS.

NI/A3 Rut depth

To measure rut depth, TRACS survey vehicles record the transverse profile of the road surface at 200 points over a minimum width of 3.8 m using lasers. They also record the road marking profile over a minimum width of 3.8 m and at the same transverse and longitudinal locations as the transverse profile. The 200 transverse profile measurements are processed in MSP, which uses an algorithm to simulate placing a notional 2-m straight edge on the recorded transverse profile, and measuring the largest deviation from the straight edge to the transverse profile, excluding any measurements made on road markings. This calculation is carried out for each wheel-track. MSP calculates the average of the individual rut depths for each wheel-track over 10-m lengths for storage within the PMS.

The transverse profile measurement method of rut depth determination used by TRACS vehicles has been shown to be highly comparable with the measurements made using a conventional straight edge and wedge.

It is recommended that, where any length has been identified for further investigation as a result of deep rut depths, that comparison be made between the left rut and right rut length weighted average values contained within the PMS. This is to check that there are no excessive differences which could be caused by the inclusion of the edge line in the left or right rut measurements.

NI/A4 Enhanced longitudinal profile variance (eLPV) and bump measure

NI/A4.1 eLPV

The main parameter currently used for the assessment of ride quality, or profile unevenness, is the enhanced longitudinal profile variance (eLPV) of individual deviations of the profile relative to a datum obtained by removing (or filtering) longer wavelengths from the measured longitudinal profile. This parameter was introduced in June 2004 and uses sophisticated filtering which removes the effects of the pavement geometry (gradient, crossfall and curvature), which had previously caused high levels of variance at, for example, the approaches to roundabouts. The previous simpler method of filtering produced the parameter longitudinal profile variance (that is, unenhanced).

The eLPV value reflects the unevenness associated with profile features that are equal to or less in wavelength than the length of the filter used to calculate the eLPV. For example, the variance of deviations from a 3-m filter reflects the unevenness of profile features with wavelengths equal to or less than approximately 3 m.

The measurement of profile unevenness can be used to investigate the ride quality of the pavement. The short, medium and long wavelength features that are found to relate with the perceived effect on vehicle ride are represented by variance from 3-m, 10-m and 30-m filters respectively. The 3-m, 10-m and 30-m eLPV values are calculated from the TRACS longitudinal profile measurements by MSP and averaged over 10-m lengths for storage within the PMS.

Extremes of 10-m eLPV may arise from poor reinstatements along the wheel-track, the presence of high and/or variable levels of rutting, and bay length irregularities (in concrete roads). High levels of 30-m enhanced longitudinal profile variance may be associated with subsidence. Changes of crossfall along the length of a road may also result in slightly higher 30-m eLPV being reported.

High levels of profile unevenness do not only affect ride quality. High levels of profile unevenness, particularly in the 3-m and 10-m wavelength ranges, have been shown to contribute to increased dynamic loading of the pavement, hence accelerating the deterioration of the road pavement. Extremes of profile unevenness can also lead to increased stopping distances, and can have an adverse effect on vehicle manoeuvrability and safety.

Research carried out on TRACS measurements has shown that TRACS survey vehicles may provide eLPV data having lower levels of accuracy when surveying at slow speed, or under conditions of significant acceleration or (more commonly) deceleration. To reduce the occurrence of low accuracy data, limits have been specified for the TRACS surveys for speed and acceleration/deceleration beyond which the data is considered invalid. Where these limits have been exceeded, the data is marked as "unreliable" in the TRACS base eLPV data. The presence of a significant proportion of unreliable values within any 100-m length results in missing values when the data is expressed as 100-m length weighted averages in the PMS.

To distinguish between moving average LPV (reported prior to 1st June 2004) and eLPV, the TRACS length weighted averages data source in HAPMS provides an additional label for the LPV data called “enhanced”. Where the label is not present this indicates that the value reported in the the PMS TRACS length weighted averages data source is the old moving average LPV.

NI/A4.2 Bump measure

Research has shown that road users are also sensitive to short length “bump” features that cause jolt-like sensations within the vehicle. These features are not effectively identified using the eLPV measure. Therefore a measure, called the “bump measure” was developed. The bump measure has been designed to identify lengths of pavement containing short defects (“bumps”), such as sunken ironwork, potholes, and poor joints. Such defects can cause jolting discomfort to the road user.

The bump measure is calculated from the longitudinal profile, and initially reported over 10-m lengths. It reports either 0 or 1 for each reporting length, with a 1 indicating that the length contains one or more bumps.‘Left bump’ indicates whether there is one or more bumps in the left wheeltrack and ‘right bump’ indicates whether there is one or more bumps in the right wheeltrack.

TRACS length-weighted average bump measure is reported over 100-m lengths and has a value of 0 or 1, where a 1 indicates that the length contains one or more bumps. The bump measure does not give any indication of the number of bumps in the reporting length.

NI/A5 Lane fretting intensity

TRACS "lane fretting" has been reported since January 2014. This replaced the TRACS "fretting" parameter which was delivered between June 2004 and January 2014. The older fretting parameter provided an indication of the amount of fretting present on HRA surfaced pavements only and was calculated from the texture profile measured in the left wheeltrack.

TRACS lane fretting has been introduced to improve the ability to identify fretting by using multiple lasers across the width of the survey vehicle to provide a measure of the amount of fretting present on the whole lane width. The parameter uses a different approach to calculating fretting so that the measure is able to identify fretting on all asphalt surface types. The values reported by the measure are not comparable to the values reported by the previous single line measure.

The lane fretting algorithm reports the intensity of lane fretting in the range 0 to 625. In general, the higher the value of the fretting parameter, the more likely it is that there is fretting present at that location on the network, and the more severe that fretting is likely to be. However, the way the parameter is calculated means that the values actually quantify how different a local part of the pavement is from its surroundings.

Significant weight should not be unduly applied to moderate proportional differences in the lane fretting Intensity. For example it should not be assumed that lengths with lane fretting of 8 are twice as fretted as lengths with lane fretting of 4. A value of lane fretting of 17.5 in one location is not necessarily more fretted than a value of 16.4 in another place – both locations are probably fretted and should be investigated.

It may not be possible to calculate a value of lane fretting intensity where the survey measurements include a large area of road markings, or where a number of surfacing changes were identified within a short distance of one another, or where the driving line of the survey vehicle deviated from the required survey line and the data were flagged as being out of line by the survey contractor. The values are not to be compared directly with measures obtained from manual visual condition surveys.

Skip to content

Design Manual for Roads and Bridges

Pavement

Inspection & Assessment

CS 230 - SNAA Scotland National Application Annex for Pavement maintenance assessment procedure

(formerly HD 30/08 (parts))

Version 0.0.1

Summary

This National Application Annex contains the Transport Scotland-specific requirements for routine, network-level surveys of pavement surface condition and structural condition.

Feedback and Enquiries

Users of this document are encouraged to raise any enquiries and/or provide feedback on the content and usage of this document to the dedicated Transport Scotland team. The email address for all enquiries and feedback is: TSStandardsBranch@transport.gov.scot

This is a controlled document.

Latest release notes

Document Code Version number Date of publication of relevant change Changes made to Type of change
CS 230 - SNAA 0.0.1 December 2022 Scotland NAA Incremental change to notes and editorial updates
Rev. 0.0.1 (Dec. 2022 ) Change of brand from Highways England to National Highways, plus minor editorial changes. Rev. 0: Transport Scotland National Application Annex to CS 230.

Previous versions

Document Code Version number Date of publication of relevant change Changes made to Type of change
CS 230 0 March 2020

Foreword

Publishing information

This document is published by National Highways on behalf of Transport Scotland.

Together with DMRB CS 229 [Ref 1.N] and CD 227 [Ref 2.N], this document supersedes HD 29/08 and HD 30/08, which are withdrawn.

Contractual and legal considerations

This document forms part of the works specification. It does not purport to include all the necessary provisions of a contract. Users are responsible for applying all appropriate documents applicable to their contract.

Introduction

Background

This national application annex gives the Transport Scotland-specific requirements for routine, network-level surveys of pavement surface condition and structural condition. It sets out the requirements for reviewing the outputs from these surveys in order to identify lengths of carriageway that are potentially in need of maintenance and that require a detailed assessment. It does not cover the routine measurement of skidding resistance, which is dealt with in DMRB CS 228 [Ref 6.N].

This document also sets out the requirements for identifying technically simple pavement schemes (TSS). Technically simple pavement schemes are lengths of carriageway where there are no structural problems i.e. where deterioration is confined to the surface course. These schemes will require renewal of only the surface course and are subject to a simplified development and assessment process.

Assumptions made in the preparation of this document

The assumptions made in GG 101 [Ref 4.N] apply to this document.

Abbreviations

Abbreviations
Abbreviation Definition
SCANNER Surface condition assessment of the National NEtwork of roads
PMS Pavement management system
LPV Longitudinal profile variation
SMTD Sensor measured texture depth
HFS High friction surfacing
TSS Technically simple pavement schemes

S/1. Network level surveys

Surface condition surveys (CS 230, 2.2)

Surface Condition Assessment of the National Network of Roads (SCANNER)

S/1.1 On the National Network in Scotland, traffic-speed surveys shall be carried out using the Surface Condition Assessment of the National Network of Roads (SCANNER) system.

NOTE This survey system had been developed by the UK Roads Board to provide a consistent method of measuring the surface condition of Local Authority carriageways, using automated road condition survey machines, throughout the UK . Full details are given in the five-volume User Guide and Specifications published by the UK Roads Board (2007).

S/1.2 Before a survey vehicle can be used to carry out a SCANNER survey, it shall pass accreditation tests each year and be operated with a defined quality assurance procedure with an independent auditor.

S/1.3 The survey data produced by the survey machines shall be loaded into the pavement management system (PMS) for highway maintenance and management purposes.

S/1.4 SCANNER surveys of the Trunk Road network shall commence no earlier than the 1st April and are to be completed by the 30th June each year.

SCANNER texture depth, rut depth, LPV and cracking

S/1.5 The SCANNER texture depth, rut depth, longitudinal profile variation and cracking survey data shall be assessed against the three condition categories defined in Table S/1.5.

Table S/1.5 Investigtion thresholds for SCANNER texture depth, rut depth, LPV and cracking
Condition category Definition
Green Sound - negligible deterioration
Amber Some to moderate deterioration
Red Moderate to severe deterioration

Rut depth

S/1.6 The SCANNER rut depth levels that shall be used to define condition category are given in Table S/1.6.

Table S/1.6 Condition categories for SCANNER rutting measurements
Condition category Maximum rut depth for motorways and dual carriageways (mm) Maximum rut depth for single carriageways (mm)
Green < 10 <10
Amber 10 - 15 10-20
Red >15 >20

Texture depth

S/1.7 The SCANNER texture depth levels that shall be used to define condition category are given in Table S/1.7

Table S/1.7 Condition categories for SCANNER texture measurements
Condition category texture depth (SMTD)
High friction surfacing (HFS) All other surfaces
Green
>0.6 >0.7
Amber ≤0.6 0.4< (SMTD) ≤0.7
Red N/A ≤0.4

NOTE 1 Texture is reported on all surface types.

NOTE 2 Changes in texture depth can indicate a potential loss of skid resistance. Advice on the interpretation of texture depth data in connection with skid resistance is given in [ CS 228 [Ref 6.N].

NOTE 3 Lower texture depth values are applied to HFS due to the different way in which skid resistance is provided by these materials.

NOTE 4 The texture depth of HFS can only be in condition category green or amber.

Longitudinal profile variance (LPV)

S/1.8 The SCANNER LPV levels that shall be used to define condition category are given in tables S/1.8a and S/1.8b

Table S/1.8a Condition categories for LPV on motorways and dual carriageways
Condition category Longitudinal profile variance (mm2)
3 m 10 m
Green <2.8 <16
Amber 2.8 - 5.6 16 - 36
Red >5.6 >36
Table S/1.8b Condition categories for LPV on single carriageways
Condition category Longitudinal profile variance (mm2)
3 m 10 m
Green <4 <21
Amber 4 - 8 21 - 56
Red >8 >56

NOTE 1 The LPV measures reported indicate the level of profile unevenness within wavelength ranges less than or equal to 3 m and 10 m. These values are broadly correlated to levels of ride comfort (ride quality).

NOTE 2 The LPV values are set to reflect the standard of ride quality required on different types of road. For example, motorways require a better standard of ride quality than urban carriageways.

Cracking

S/1.9 The SCANNER cracking levels that shall be used to define condition category are given in Table S/1.9.

Table S/1.9 Condition categories for SCANNER cracking %
Condition category Cracking %
Green <0.5
Amber 0.5 - 2
Red >2

Structural condition surveys (CS 230, 2.3)

Deflectograph surveys

S/1.10 Network level deflectograph structural condition surveys on the Transport Scotland trunk road network shall be undertaken as part of the Transport Scotland road condition survey contract, centrally managed by Transport Scotland.

NOTE The coverage and frequency of surveys are set out in the Scottish National Application Annex for CD 227 NAA(S) [Ref 3.N].

S/1.11 Deflectograph surveys shall be in accordance with section 3 of CS 229 [Ref 1.N] .

S/1.12 The deflectograph levels that shall be used to define condition categories are given in Tables S/1.12a-c

Table S/1.12a Deflectograph condition categories on motorways
Condition category Deflectograph (years) Deflectograph (Def)
Green >6 <25
Amber 6 - 2 25 - 35
Red < 2 >35
Table S/1.12b Deflectograph condition categories on dual carriageways
Condition category Deflectograph (years) Deflectograph (Def)
Green >6 <25
Amber 6 - 0 25 - 35
Red 0 >35
Table S/1.12c Deflectograph condition categoried on single carriageways
Condition category Deflectograph (years) Deflectograph (Def)
Green >6 <35
Amber 6 - 0 35 - 50
Red 0 >50

S/2. Review of data (CS 230, 4.1)

S/2.1 SCANNER and deflectograph condition data, obtained from the Transport Scotland pavement management system (PMS), and the additional data described in CS 230 [Ref 5.N]and CD 227 NAA(S) [Ref 3.N] shall be collated and reviewed on an annual basis in order to identify lengths of pavement that are showing signs of deterioration.

S/2.2 SCANNER and deflectograph data for texture depth, rutting, LPV, cracks and deflection shall be assessed against the condition categories defined in Table S/1.5.

NOTE Time series analysis can be useful in determining how quickly pavements are deteriorating.

S/3. Normative references

The following documents, in whole or in part, are normative references for this document and are indispensable for its application. For dated references, only the edition cited applies. For undated references, the latest edition of the referenced document (including any amendments) applies.

Ref. Document
Ref 1.N National Highways. CS 229, 'Data for pavement assessment'
Ref 2.N National Highways. CD 227, 'Design for pavement maintenance'
Ref 3.N National Highways. CD 227 NAA(S), 'Design for pavement maintenance'
Ref 4.N National Highways. GG 101, 'Introduction to the Design Manual for Roads and Bridges'
Ref 5.N National Highways. CS 230, 'Pavement maintenance assessment procedure'
Ref 6.N National Highways. CS 228, 'Skidding resistance'
Skip to content

Design Manual for Roads and Bridges

Pavement

Inspection & Assessment

CS 230 - WNAA Wales National Application Annex for Pavement maintenance assessment procedure

(formerly HD 30/08 (parts))

Version 0.0.1

Summary

This National Application Annex contains the Welsh Government-specific requirements for routine, network-level surveys of pavement surface condition and structural condition.

Feedback and Enquiries

Users of this document are encouraged to raise any enquiries and/or provide feedback on the content and usage of this document to the dedicated Welsh Government team. The email address for all enquiries and feedback is: Standards_Feedback_and_Enquiries@gov.wales

This is a controlled document.

Latest release notes

Document Code Version number Date of publication of relevant change Changes made to Type of change
CS 230 - WNAA 0.0.1 December 2022 Wales NAA Incremental change to notes and editorial updates
Rev. 0.0.1: (Ver. 1 Dec. 2022) Change of brand from Highways England to National Highways plus multiple revisions of requirements and layout (Neil Bromham). Rev. 0: Welsh Government National Application Annex to CS 230.

Previous versions

Document Code Version number Date of publication of relevant change Changes made to Type of change
CS 230 0 March 2020

Foreword

Publishing information

This document is published by National Highways on behalf of the Welsh Government.

Together with DMRB CS 229 [Ref 1.N] and CD 227 [Ref 2.N], this document supersedes HD 29/08 and HD 30/08, which are withdrawn.

Contractual and legal considerations

This document forms part of the works specification. It does not purport to include all the necessary provisions of a contract. Users are responsible for applying all appropriate documents applicable to their contract.

Introduction

Background

This national application annex gives the Welsh Government (WG) requirements for routine, network-level surveys of pavement surface condition and structural condition. It sets out the requirements for reviewing the outputs from these surveys in order to identify lengths of carriageway that are potentially in need of maintenance and that require a detailed assessment. It does not cover the routine measurement of skidding resistance which is dealt with in DMRB CS 228 [Ref 1.I].

This document also sets out the requirements for identifying technically simple pavement schemes (TSS). Technically simple pavement schemes are lengths of carriageway where there are minimal structural problems i.e. where deterioration is mainly confined to the surface course. These schemes will require renewal of the surface course and are subject to a simplified development and assessment process.

Assumptions made in the preparation of this document

The assumptions made in GG 101 [Ref 3.N] apply to this document.

Abbreviations

Abbreviations
Abbreviation Definition
BITS Bituminous (base type)
BCD Base condition data
CBT Characteristic base type
CEMT Cementitious (base type)
CRCP Continuously reinforced concrete pavement
eLPV Enhanced longitudinal profile variance
GNCA Granular with no cementing action (base type)
HBM Hydraulically bound mixture
HFS High friction surfacing
HRA Hot rolled asphalt
IRIS Integrated roads information system
LPV Longitudinal profile variance
LW Length weighted
LWAVG Length weighted average
LRP Location reference point
MSP Machine survey pre-processor
NSC Network structural condition
PMS Pavement management system
RCD Raw condition data
SMTD Sensor measured texture depth
SCANNER Surface condition assessment for the national network of roads
TSS Technically simple pavement scheme
WG Welsh Government

W/1. Network level surveys

Surface condition surveys (CS 230, 2.2)

Network level road condition surveys contract and parameters

W/1.1 Network level road condition surveys on the WG motorway and all-purpose trunk road network, shall be undertaken as part of the Integrated Roads Information System (IRIS) contract or future alternatives managed by Welsh Government.

W/1.2 Network level road condition surveys shall include:

  1. SCANNER;
  2. Deflectograph; and,
  3. Skidding resistance (referred to as SCRIM).

NOTE 1 SCANNER has been developed by the UK Roads Board (now UKRLG) to provide a consistent method of measuring the surface condition of carriageways. Full details are given in the 5-volume User Guide and Specifications published by the UK Roads Board (2011).

NOTE 2 Details of accredited devices are available on the UKRLG website at the following link: https://ukrlg.ciht.org.uk/ukrlg-home/guidance/road-condition-information/data-collection/scanner/

NOTE 3 The survey coverage and frequency are documented in the IRIS contract. These network level surveys will be undertaken as follows:

  1. Lane 1 on the motorway and dual carriageway network;
  2. both lanes of the single carriageway network;
  3. Lane 1 of slip roads; and,
  4. roundabouts are not included.

W/1.3 All survey data produced by the survey shall be capable of being loaded into IRIS and be controlled by a detailed quality assurance procedure for the surveys, which includes the processing of the survey data.

W/1.4 The SCANNER surveys will be undertaken within the appropriate financial year; however, no surveys shall be be undertaken in December and January unless explicitly agreed by WG.

W/1.5 The SCANNER survey shall capture the full list of parameters detailed in the SCANNER specifications, including:

  1. rutting and transverse profile;
  2. longitudinal profile: 3 m and 10 m. Enhanced longitudinal profile;
  3. sensor measured texture depth;
  4. whole carriageway cracking;
  5. alignment, including curvature, cross-fall and gradient;
  6. GPS; and,
  7. forward facing video.

NOTE Road geometry measurements are used to assist in the assessment of site category and investigatory levels of skidding resistance. See DMRB CS 228 [Ref 1.I].

W/1.6 Primary reporting from SCANNER shall be the 10-m data, and 100-m summary data. The 10-m data will be used for asset management purposes, and the 100-m data used with other condition data for the management of works programmes.

W/1.7 The SCANNER rut depth, texture depth, longitudinal profile variance (LPV) and cracking data shall be assessed individually and collectively against the three condition categories defined in Table W/1.7.

Table W/1.7 10-m condition categories
Condition category Definition
Green Sound – negligible deterioration
Amber Slight to moderate deterioration
Red Moderate to severe deterioration

Rut depth

W/1.8 The values used to define the condition category for rut depth, shall be in accordance with Table W/1.8 below.

Table W/1.8 Condition category for rut depth
Condition category Maximum rut depth (mm) - maximum of left and right wheel-path rut
Motorway Dual Single
Green <6 <8 <10
Amber 6-10 8-12 10-15
Red >10 >12 >15

Texture depth

W/1.9 The values used to define the condition category for texture depth, shall be in accordance with Table W/1.8 below.

Table W/1.9 Condition category for texture depth
Condition category Left wheel-path texture (mm)
Motorway Dual Single
Green >0.6 >0.75 >0.75
Amber le 0.8-0.6 le 0.75-0.5 le 0.75-0.5
Red <0.6 <0.5 <0.5

Longitudinal profile variance 3-m and 10-m wavelength (LPV3 & 10)

W/1.10 The values to define condition category for LPV, shall be in accordance with Tables W1.10 a&b below.

Table W/1.10a Condition category for LPV3
Condition category 3-m Longitudinal profile variance LV3 (mm2)
Motorway Dual Single
Green <15.0 <15.0 <21.0
Amber ge 2.8-3.8 ge 4.0-5.6 ge 4.0-7.5
Red ge 3.8 ge 5.6 ge 7.5
Table W/1.10b Table W/1.10b Condition category for LPV 10
Condition category 10-m Longitudinal profile variance LV10 (mm2)
Motorway Dual Single
Green <15.0 <15.0 <21.0
Amber ge 15.0-30.0 ge 15.0-30.0 ge 21.0-56.0
Red ge 30 ge 30 ge 56

Cracking intensity (whole carriageway)

W/1.11 The values that shall be used to define condition category for cracking intensity are given in Table W1.11 below.

Table W/1.11 Condition category for cracking intensity
Condition category Whole carriageway cracking (%)
Motorway Dual Single
Green <0.25% <0.25% <0.35%
Amber ge 0.25%-1.5% ge 0.25%-1.5% ge 0.25%-1.5%
Red ge 1.5% ge 1.5% ge 1.5%

Summary data

W/1.12 Data will be processed in IRIS to provide 100-m summary data. This shall be the average of the parameter value for each 100-m length of the network.

W/1.13 This shall be compared to the condition categories detailed in Table W.1.13.

Table W/1.13 Condition categories for SCANNER
Condition category Definition
1 Sound - limited deterioration
2 Some deterioration - low level of concern
3
Moderate deterioration - warning level of concern
4 Severe deterioration. Intervention level of concern

Rut depth

W/1.14 Ruts generated from SCANNER shall be used to define condition categories.

Table W/1.14 Rut depth
Condition category Maximum rut
1 <6 mm
2 ge 6 mm-<11 mm
3 ge 11 mm-<20 mm
4 ge 20 mm

NOTE 1 The categories apply to the 100-m length weighted average maximum rut as reported by IRIS.

NOTE 2 Rutting is reported for all surface types.

Texture depth

W/1.15 Texture depth generated from SCANNER shall be used to define condition categories.

Table W/1.15 Condition categories for SCANNER texture depth measurement (100-m lengths)
Texture depth (SMTD)
Condition category High friction surfacing All other surfaces
1 >0.6 mm >1.1 mm
2 ge 0.6mm le 1.1 mm and <0.8 mm
3 n/.a le 0.8 mm and < 0.4 mm
4 n/a le 0.4 mm

NOTE 1 The categories apply to the 100-m length weighted average texture depth as reported by IRIS.

NOTE 2 Texture is reported on all surface types.

NOTE 3 100-m texture depth >1.5 mm will be considered category 2.

NOTE 4 Changes in texture depth can indicate a potential loss of skid resistance. Advice on the interpretation of texture depth data in connection with skid resistance is given in CS 228 [Ref 1.I].

NOTE 5 Lower texture depth values are applied to HFS due to the different way in which skid resistance is provided by these materials. The texture depth of HFS can only be in condition category 1 or 2.

Enhanced longitudinal profile variance (ELPV)

W/1.16 The SCANNER eLPV levels that shall be used to define condition category are given in tables W1.15a to W1.15c.

Table W/1.16a Condition categories for eLPV on motorways and rural dual carriageways (100-m lengths)
Enhanced longitudinal profile variance (mm2)
Condition category High friction surfacing All other surfaces
3 m 10 m
1 <0.7 <1.6
2 ge 0.7 and <2.2 ge 1.6 and <6.5
3 ge 2.2 and <4.4 ge 6.5 and <14.7
4 ge 4.4 ge 14.7
Table W/1.16b Condition categories for eLPV on urban dual cariageways and rural single carriageways (100-m lengths)
Enhanced longitudinal profile variance (mm2)
Condition category High friction surfacing All other surfaces
3 m 10 m
1 <0.8 <2.8
2 ge 0.8 and <2.2 ge 2.8 and <8.6
3 ge 2.2 and <5.5 ge 6.5 and <14.7
4 ge 5.5 ge 22.8
Table W/1.16c Condition categories for eLPV on urban single carriageways (100-m lengths)
Enhanced longitudinal profile variance (mm2)
Condition category High friction surfacing All other surfaces
3 m 10 m
1 <1.4 <6.1
2 ge 1.4 and <3.8 ge 6.1 and <18.3
3 ge 3.8 and <9.3 ge 18.3 and <36.6
4 ge 9.3 ge 36.6

NOTE 1 The categories apply to the 100-m length weighted average texture eLPV as reported by IRIS. This data is held in the SCANNER Defects RP701 Summary tables, and is reported in both wheel-paths, and as a lane measurement.

NOTE 2 The eLPV measures reported in IRIS indicate the level of profile unevenness within the wavelengths less than equal to 3 m or 10 m. 30-m eLPV is not reported in IRIS.

NOTE 3 The eLPV values are set to reflect the standard of ride quality required on different types of road. For example, motorways require a better standard of ride quality than urban single carriageways.

NOTE 4 The road classifications are based on the speed limit and the carriageway types in IRIS.

NOTE 5 Research into measurement of texture variability is being undertaken. It is anticipated that these measurements will be used to determine the variability of texture depth, as an indicator of fretting and early failures.

Structural condition surveys (CS 230, 2.3)

Deflectograph surveys

W/1.17 Network level structural condition surveys on the WG motorway and trunk road network shall be undertaken by Deflectograph, which is currently part of the WG IRIS contract.

NOTE 1 Deflectograph data is only valid for flexible pavements i.e., flexible with an asphalt base and flexible with an HBM base.

NOTE 2 The current IRIS contract expires 31st March 2023.

NOTE 3 Deflectograph survey coverage and frequency will vary every year. Roundabouts are not included, unless specifically added to the survey programme.

W/1.18 All Deflectograph machines shall have the appropriate accreditation for use on the WG road network.

W/1.19 The Deflectograph surveys shall be controlled by a detailed quality audit procedure, which includes regular independent checks to maintain quality assurance.

W/1.20 Deflectograph surveys shall be used to provide information about the structural condition of flexible pavements.

W/1.21 Deflectograph data is available in IRIS PMS and shall be referenced to the IRIS PMS network.

W/1.22 Service providers shall use the latest reliable construction and traffic information when using deflectograph data for assessment purposes.

NOTE The robustness of the reported deflectograph survey results will critically dependent on the availability of accurate construction and traffic data in IRIS PMS.

Condition categories

W/1.23 Deflectograph results shall be assessed against the structural condition categories defined in Table W/1.22.

Table W/1.23 Structural condition categories
NSC category Residual life (years) Description
1 >20 No structural maintenance required
2 10 to 20 Pavements unlikely to need structural maintenance
3 0 to 9 Pavement can need structural maintenance
4 <0 Pavements likely to need structural maintenance
Null Null Unable to complete valid analysis

NOTE 1 The condition categories apply to the 100 m of Deflectograph readings NSC as reported by IRIS PMS.

NOTE 2 Condition categories will be reported as "null" when it is not possible to complete the analysis procedure satisfactorily. For example, where pavement quality concrete is present or where accurate construction and / or traffic data are not available.

NOTE 3 The need for Deflectograph surveys as part of a renewal pavement investigation is given in CD 227 [Ref 2.N].

NOTE 4 Deflectograph surveys are not applicable for rigid or composite pavement constructions.

W/2. Review of data (CS 230, 4.1)

W/2.1 SCANNER and Deflectograph condition data along with the additional data described in CS 230 [Ref 4.N], shall be collated and reviewed to identify lengths of pavement that are showing signs of deterioration.

W/2.2 All reviewed machine-based survey data, shall be used to assist in identifying lengths of the network that warrant detailed investigation in order to determine the causes and extent of the deterioration.

W/2.3 The 10-m summary data shall be used to complement the 100-m summary data as part of this review, with individual parameters used to determine the mode of deterioration and the most suitable treatment processes to restore service life of the carriageway.

NOTE 1 This process may be significantly aided by an IRIS which can run multiple queries and combine data-sets from different survey types into one query.

NOTE 2 Short isolated lengths (100 m) exhibiting slight levels of deterioration are unlikely to require further investigation.

NOTE 3 Lengths of carriageway exhibiting significant levels of deterioration or adjacent lengths that are exhibiting moderate levels of structural deterioration are likely to require further investigation.

SCANNER data

W/2.4 Only the most current data available from IRIS PMS, must be used for the initial network review.

W/2.4.1 Previous year's data may be used to provide an indication of the rate of change of condition.

NOTE 1 Deterioration modelling can be useful in determining how quickly pavements can deteriorate.

NOTE 2 Some of the parameters have changed how they are reported over time and it is not appropriate to directly compare values for these parameters.

NOTE 3 The analysis of the rate of change of data over time is an excellent way of determining deterioration, as is the use of additional data sets that can be derived from the raw data collected by SCANNER survey vehicles.

Texture, rutting and LPV

W/2.5 SCANNER data for texture depth, rutting and ride quality shall be assessed against the four condition categories defined in Table W/1.12.

W/2.6 Any 100-m length in condition category 4 shall be assessed as showing signs of deterioration.

W/2.7 Any two 100-m lengths in condition category 3 within 1 km of one another shall be assessed as showing signs of deterioration.

Deflectograph data

W/2.8 For the network review, Deflectograph condition data (100-m reporting length) shall be obtained from IRIS PMS using the most recent deflectograph data source.

NOTE The IRIS PMS database contains current and historical deflectograph data.

W/2.9 The structural condition of each 100-m reporting length shall be assigned one of the five levels of structural condition as defined in Table W/1.22.

NOTE Deflectograph survey data can be used to assist in the identification of pavement schemes.

Identifying lengths suitable for maintenance scheme planning

W/2.10 Technically simple pavement schemes (TSS) are lengths of carriageway where there are no structural problems, i.e. where pavement deterioration is present but is confined to the upper layers. These schemes require renewal of only the surface and binder course and shall be subject to a simplified development and assessment process.

NOTE Isolated areas of structural deterioration that require deeper treatment can be included within TSS, provided they are less than 10% of the scheme area.

W/2.11 TSS shall not include lengths of pavement over structures or rigid pavement (including those with overlays).

Deeper treatments

W/2.12 Areas requiring deeper treatment within a TSS, shall be included, providing the defects cover less than 10% of the scheme area and the works cost associated with the deeper work is less than £100k (excluding the surface and binder course). Clear evidence that the work proposed to address the structural problem is appropriate will form part of the scheme submission.

NOTE The evidence can include results from previous investigations on the scheme and from similar scheme scenarios where treatments have performed well.

W/2.13 Where there is clear evidence that structural deterioration exceeds the requirements of W2.9, then the scheme shall be classed as a technically complex scheme and be investigated in accordance with CD 227 [Ref 2.N].

NOTE Assessment of characteristic skid coefficients and investigatory levels is set out in CS 228 [Ref 1.I].

Design of technically simple pavement schemes

W/2.14 Where the decision is taken to proceed with a technically simple pavement scheme, the surfacing shall be designed in accordance with Section 4 of CD 227 [Ref 2.N].

W/2.15 Any short lengths within the technically simple pavement schemes that require deeper treatment (within the limits of W/2.22) shall be designed in accordance with Section 5 of CD 227 [Ref 2.N].

NOTE All planned schemes are listed and prioritised within the 'WG Value Management Process, which can be provided upon request to WG Pavement Team.

W/3. Normative references

The following documents, in whole or in part, are normative references for this document and are indispensable for its application. For dated references, only the edition cited applies. For undated references, the latest edition of the referenced document (including any amendments) applies.

Ref. Document
Ref 1.N National Highways. CS 229, 'Data for pavement assessment'
Ref 2.N National Highways. CD 227, 'Design for pavement maintenance'
Ref 3.N National Highways. GG 101, 'Introduction to the Design Manual for Roads and Bridges'
Ref 4.N National Highways. CS 230, 'Pavement maintenance assessment procedure'

W/4. Informative references

The following documents are informative references for this document and provide supporting information.

Ref. Document
Ref 1.I National Highways. CS 228, 'Skidding resistance'

Appendix W/A. Description of SCANNER condition data

W/A1

W/A1.1 Introduction

SCANNER surveys are carried out using survey vehicles equipped with lasers, video image collection and inertia measurement apparatus to enable surveys of the road surface condition to be carried out whilst travelling at variable speeds, of up to 100 km/h, to match prevailing traffic, and hence cause minimum disruption to other road users.

As the SCANNER survey vehicles have progressed, the parameters measured and available to be reported via PMS have changed as the technology has moved on. This appendix provides a short description of each of the main pavement-related parameters available under the current SCANNER specification together with other useful parameters, similar to TRACS parameter. More information on available techniques will be available from the survey contractor.

W/A1.2 Location referencing

All data collected by SCANNER survey vehicles is referenced to the network sections. The start and end points of sections are defined by using the IRIS referencing system.

W/A1.3 Geometry

Three measures of road geometry are delivered by the SCANNER survey: gradient, cross-fall, and radius of curvature. Gradient and cross-fall are delivered as percentages, whilst radius of curvature is in metres. These measures are used primarily for the classification of site categories for assigning investigatory levels of skidding resistance (see DMRB CS 228 [Ref 1.I])

W/A1.4 Processing and reporting

SCANNER survey data is delivered either by loading directly into WG IRIS or by other agreed format such and HMDIF or CSV files to allow the client to load the data. IRIS provides maintenance engineers with access to the condition data collected from their network and enables them to identify potential maintenance schemes and to monitor network performance. The SCANNER parameters and national indicator weighting sets derived from SCANNER data can be queried in IRIS and reported using the database facilities, and can be displayed against a map background.

W/A2 Texture depth

The surface texture depth measured by SCANNER survey vehicles is the coarser element of macro-texture and the finer element of megatexture formed by aggregate particles in the asphalt surfacing or by the brushing or grooving of concrete surfacing. Texture depth contributes to skidding resistance, primarily at medium and high speeds, in two ways. Firstly, it provides drainage paths to allow water to be removed rapidly from the tyre/road interface. Secondly, the projections, which contribute to hysteresis losses in the tyre, are an important factor in the braking process. The UKPMS software calculates sensor measured texture depth (SMTD) from the raw texture profile measurements collected by SCANNER survey vehicles for the near side wheel-track and averages them over 10-m lengths for storage as base data within the PMS database.

W/A3 Rut depth

To measure rut depth, SCANNER survey vehicles use scanning lasers to record the transverse profile of the road surface at a minimum of 22 points over a minimum width of 3.2 m and a maximum width of 3.8 m. The transverse profile measurements are processed, using an algorithm to simulate placing a notional 2-m straight edge on the recorded transverse profile, and measuring the largest deviation from the straight edge to the transverse profile, excluding any measurements made on road markings. This calculation is carried out for each wheel-track. The software calculates the average of the individual rut depths for each wheel-track over 10-m lengths for storage within the client’s PMS.

The transverse profile measurement method of rut depth determination used by SCANNER vehicles has been shown to be highly comparable with the measurements made using a conventional straight edge and wedge.

It is recommended that, where any length has been identified for further investigation as a result of deep rut depths, that comparison be made between the left rut and right rut length weighted average values contained within the PMS database. This is to check that there are no excessive differences which could be caused by the inclusion of the edge line or verge in the left or right rut measurements

W/A4 Longitudinal profile variance

The main parameter currently used for the assessment of ride quality, or profile unevenness, is the enhanced longitudinal profile variance (LPV) of individual deviations of the profile relative to a datum obtained by removing (or filtering) longer wavelengths from the measured longitudinal profile.

For example, the variance of deviations from a 3-m filter reflects the unevenness of profile features with wavelengths equal to or less than approximately 3 m. The measurement of profile unevenness can be used to investigate the ride quality of the pavement. The short, medium and long wavelength features that are found to relate with the perceived effect on vehicle ride are represented by variance from 3-m, 10-m and 30-m filters respectively. Due to the nature of the A Road network the 30-m filter is not recommended for use, but it can still be derived from the raw data if required. LPV values are calculated from the SCANNER longitudinal profile measurements by the processing software and averaged over 10 m lengths for storage within PMS database.

Extremes of 3 m LPV may arise from poor reinstatements along the wheel-track, the presence of high and/or variable levels of rutting, and indicate localised failures on evolved rural roads. Extremes of 10 m LPV may also arise from poor reinstatements along the wheel-track, the presence of high and/or variable levels of rutting, the presence of inverted crowns or cambers around junctions and underlying substrate issues on evolved rural roads. High levels of 30 m enhanced longitudinal profile variance may be associated with subsidence particularly in areas of high/fluctuating water tables.

High levels of profile unevenness, particularly in the 3-m and 10-m wavelength ranges, have been shown to contribute to increased dynamic loading of the pavement, hence accelerating the deterioration of the road pavement. Extremes of profile unevenness can also lead to increased stopping distances, and can have an adverse effect on vehicle manoeuvrability and safety.

Research carried out on SCANNER measurements has shown that some SCANNER survey vehicles provide LPV data having lower levels of accuracy when surveying at slow speed, or under conditions of significant acceleration or (more commonly) deceleration. To reduce the occurrence of low accuracy data, limits have been specified for the SCANNER surveys for speed and acceleration/deceleration beyond which the data is considered invalid. These limits will be shown on the TRL Accreditation Certificate for the survey vehicle and will potentially affect the survey coverage and potentially compliance with Table 4.12 of the SCANNER Specification.

W/A5 Lane fretting intensity

The latest NH TRACS specification has introduced a measure for lane fretting intensity, the width of the survey vehicle to provide a measure of the amount of fretting present on the whole lane width. The parameter uses an approach to calculating fretting that is able to identify fretting on all asphalt surface types and is able to quantify how different a local part of the pavement is from its surroundings.

Depending on the survey machine set up it is possible to derive a lane fretting intensity from SCANNER survey data.